Optimizing Retail Operations: Clothing Store Manager Dashboard.
Overview
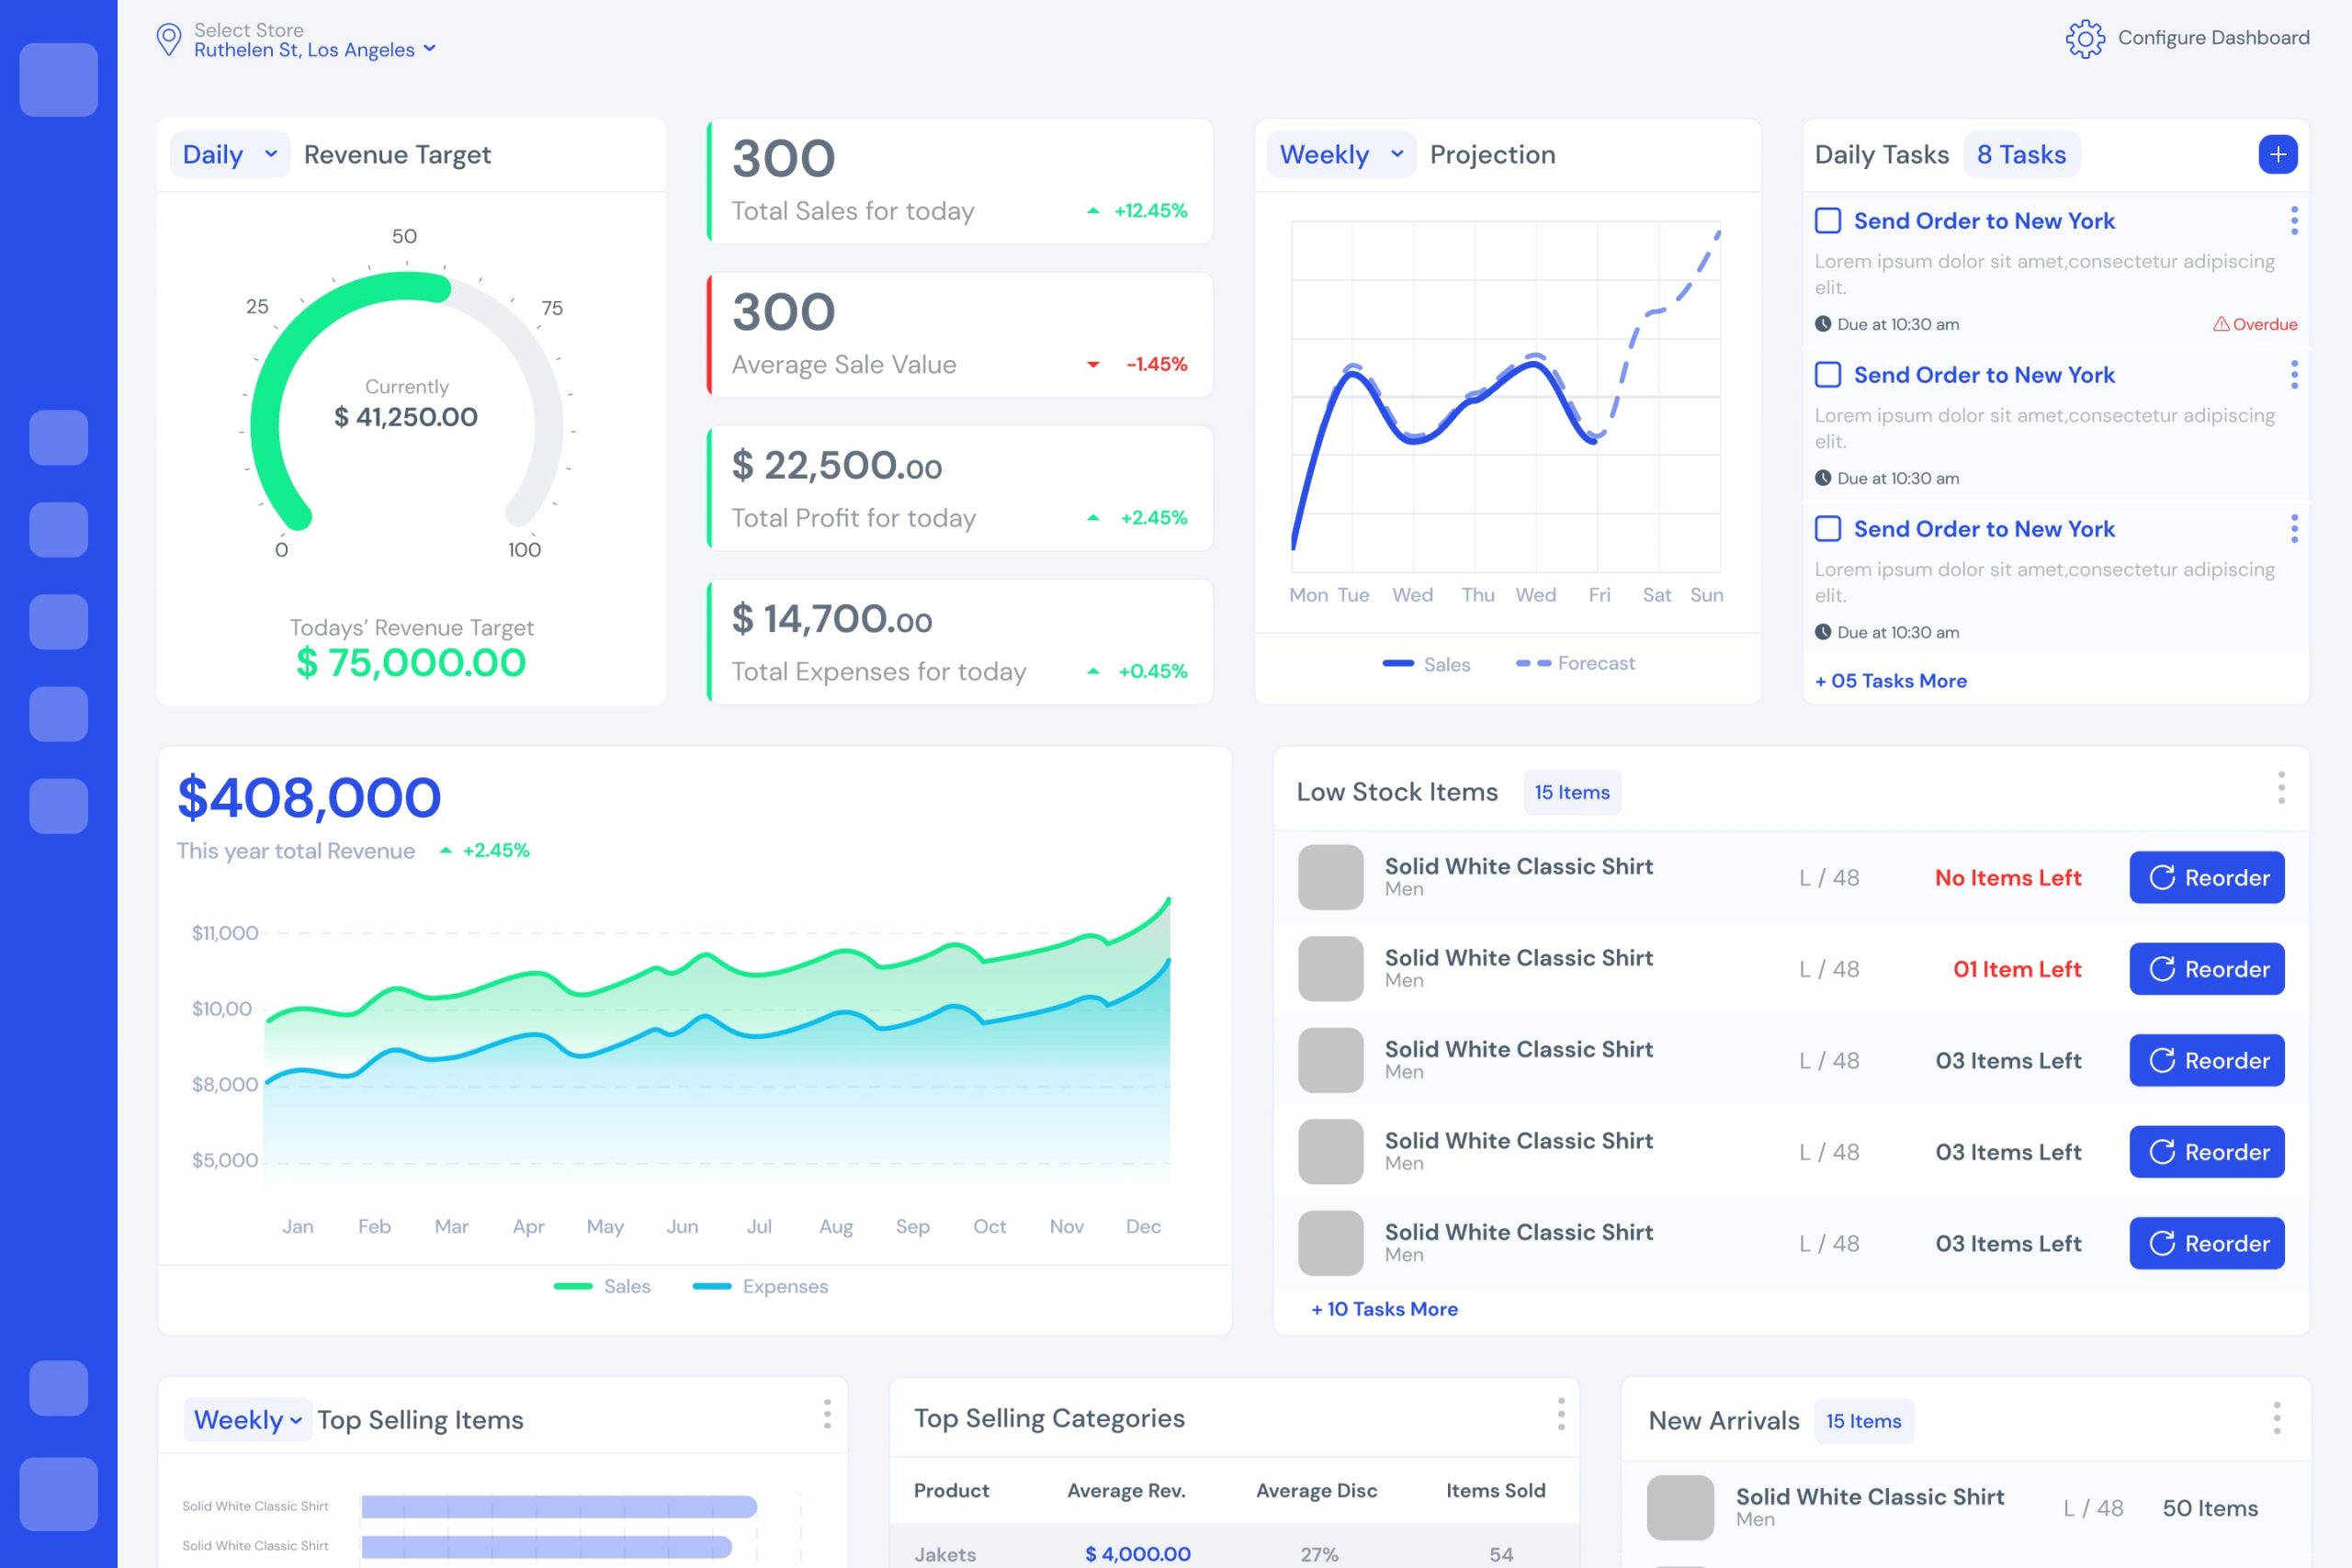
The proposed solution is a business management dashboard tailored to clothing store managers, as requested by a customer.
Clothing store managers typically devote the majority of their time to the store floor but require detailed insights into daily business performance compared to monetary targets.
Additionally, they seek assurance of sufficient clothing item stock and the ability to manage various recurring operational tasks to advance their business.
UX Research
- Conducted extensive workshops with clients to grasp their business needs, guiding the identification of critical functionalities essential for goal attainment.
- Generated detailed wireframes for each functionality, refining designs iteratively based on client feedback to ensure user-centric alignment with product features and client objectives.
Design Approach
- Prioritize and identify essential dashboard components for cohesive user experience.
- Develop low-fidelity wireframes and iterate through high-fidelity designs to optimize layout, spacing, and overall aesthetics for enhanced usability.
Assumptions & Dependencies
- Designing for a desktop web application where the dashboard is accessible to logged-in users.
- Implementing role-based access control, ensuring that users are granted access to specific dashboards based on their user type.
- Tailoring widgets and functionalities based on underlying technologies and backend capabilities to optimize user experience and functionality.
Empowering Users with a Customizable Dashboard
Key Features
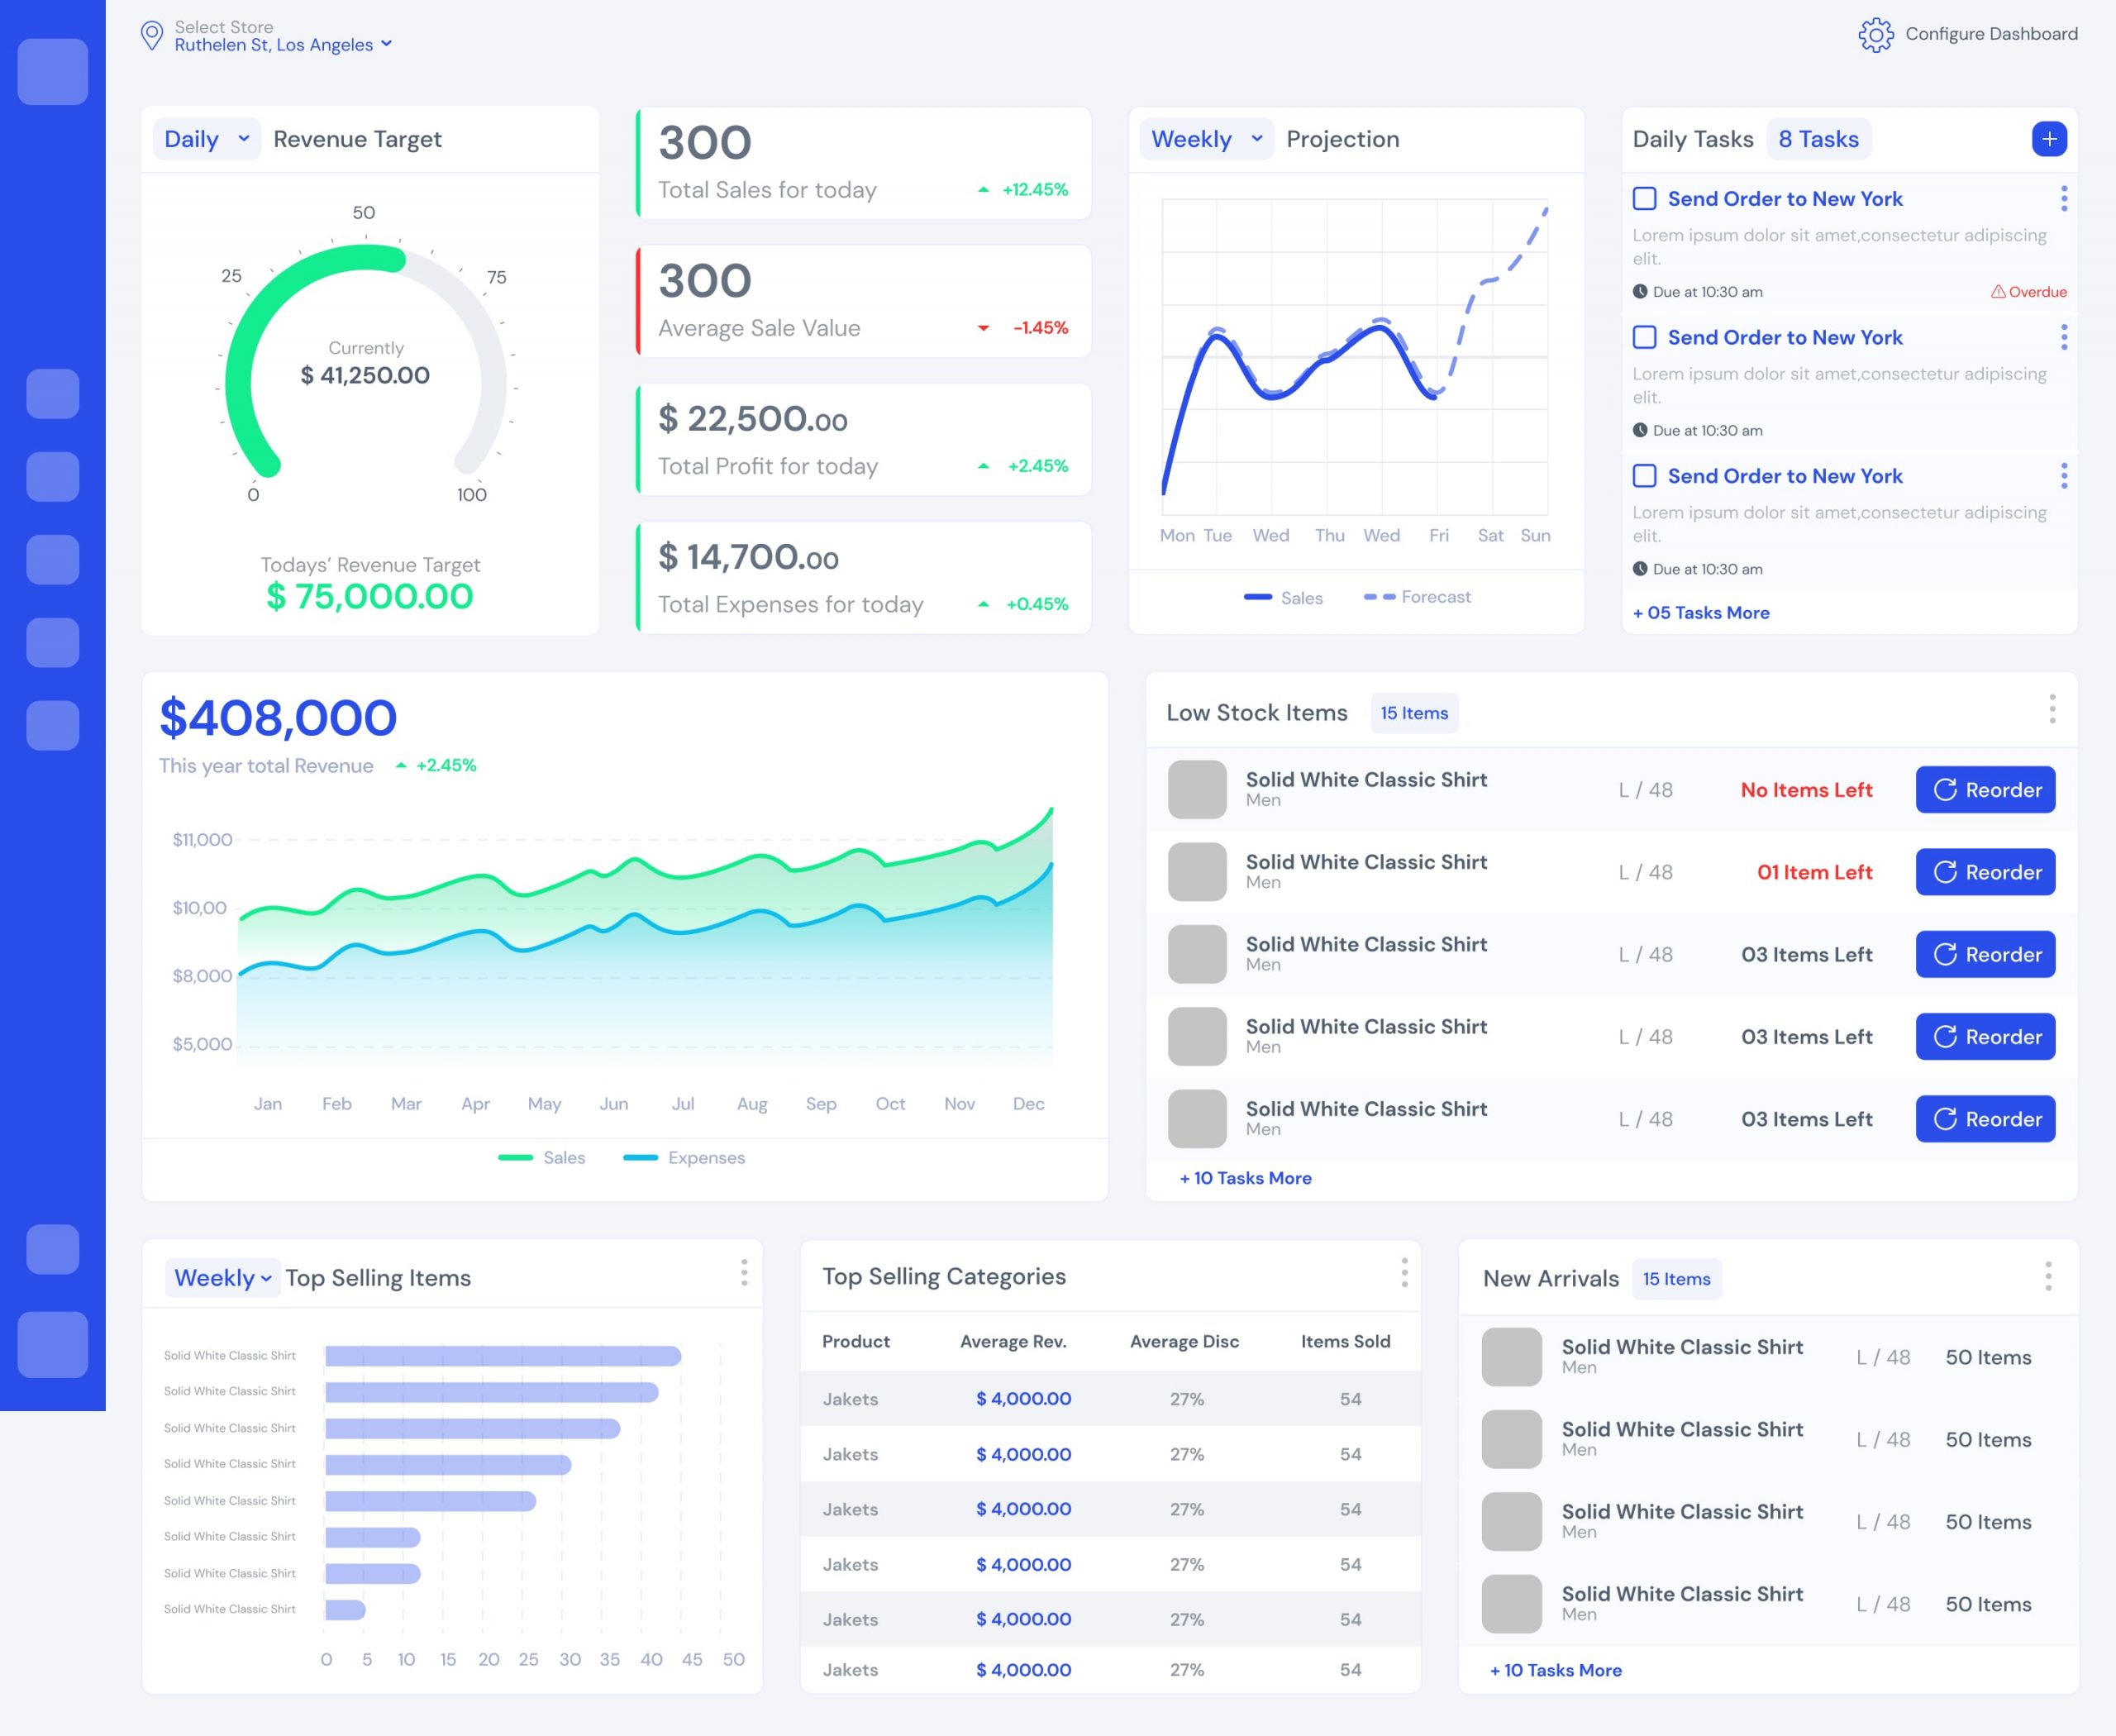
- Multi-Store Support: Users with multiple locations can switch between them seamlessly. Defaults to the user’s assigned store for a smooth login experience.
- Flexible Widget System: Users have complete control over their dashboard:
- Widget Selection: Choose which widgets appear, allowing them to focus on the data most relevant to their role.
- Widget Reordering: Drag-and-drop functionality empowers users to prioritize widgets based on their individual needs.
- Persistent User Preferences: The chosen widgets and their arrangement are automatically saved, ensuring a tailored experience on every login.
Design Considerations
- Column-based Layout: Leverages a column-based structure to allow users to configure the dashboard as a 2, 3, or 4-column grid, optimizing screen real estate for different user preferences.
- Pre-built Informative Layout: New users or those who haven’t customized are greeted by a pre-configured dashboard with three key information tiers:
- Top Row: Prioritizes daily essential metrics and usage statistics for a quick at-a-glance overview.
- Middle Row: Highlights low stock items alongside additional monitoring information, keeping critical inventory levels front-of-mind.
- Bottom Row: Presents supplementary data to support user decision-making.
- Customization Interface: A clean and intuitive interface allows users to easily add, remove, and reorder widgets with minimal effort.
Revenue Target Widget
Design Goals
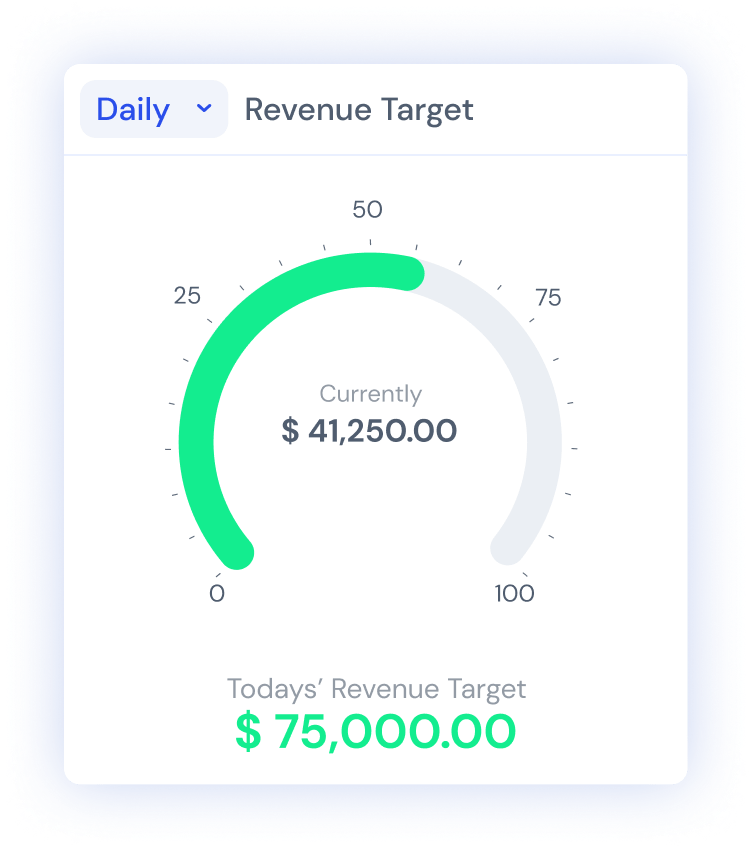
- At-a-Glance Awareness: The widget should instantly communicate the current progress towards the target through a clear and concise visual representation.
- Flexibility: Allow users to switch between different timeframes (daily, weekly, monthly, etc.) to understand progress at various time scales.
Visual Design
- Progress Bar: Leverage a progress bar to visually represent the percentage achieved.
- Monetary Values: Display both the achieved and target revenue values in clear, easy-to-read formats.
- Interactive Controls: Implement a user-friendly mechanism (e.g. dropdown menu) to allow seamless switching between timeframes.
User Experience (UX) Considerations
- Minimalism: Maintain a clean and uncluttered design to ensure the key information is readily apparent.
- Color Choice: Utilize color strategically to differentiate between progress and target values (e.g., green for progress, red for remaining target).
- Accessibility: Ensure the widget adheres to accessibility guidelines for color contrast and text size.
Daily Monetary Metrics Widget: Highlighting Performance Trends
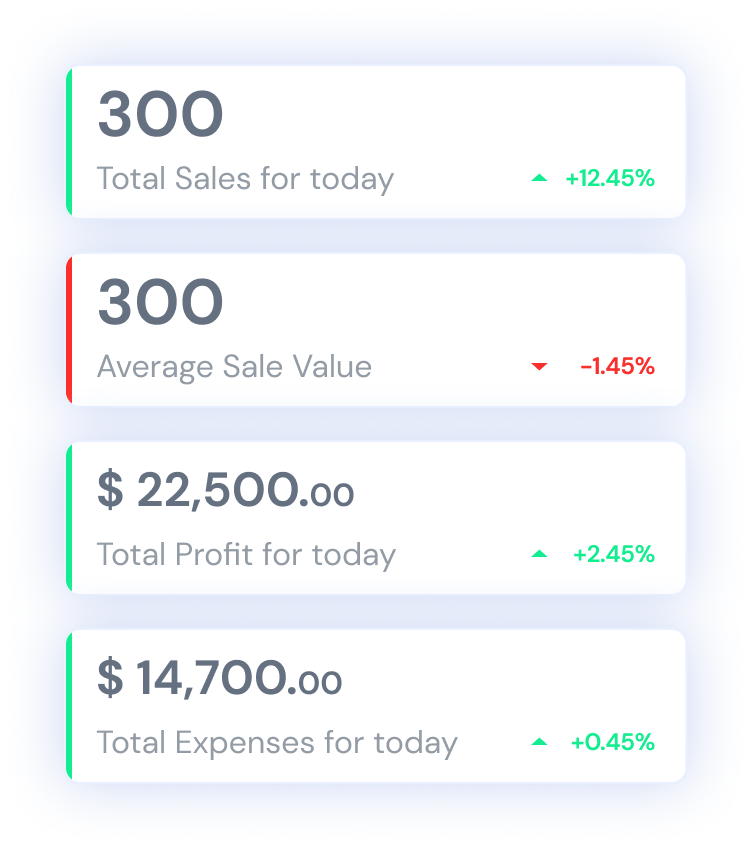
This widget empowers users to access and monitor a set of essential daily financial metrics, providing a snapshot of key performance indicators (KPIs).
Data Visualization
- Clear Breakdown: Each metric is displayed prominently and concisely, ensuring effortless comprehension at a glance.
- Percentage Change Indicators: Utilize visual elements like percentage changes to depict the difference between today’s value and the corresponding value from yesterday. Consider color-coding (e.g., green for positive change, red for negative change) for quick identification of trends.
- Optional Drill-Down Feature: Explore the possibility of allowing users to click on specific metrics for deeper analysis (optional).
Overall Design
- Conciseness and Readability: Maintain a clean and uncluttered layout to prioritize the scannability of all information and performance trends.
- Data Hierarchy: Organize metrics logically, prioritizing the most critical KPIs.
Designing an Actionable Daily Task List Widget
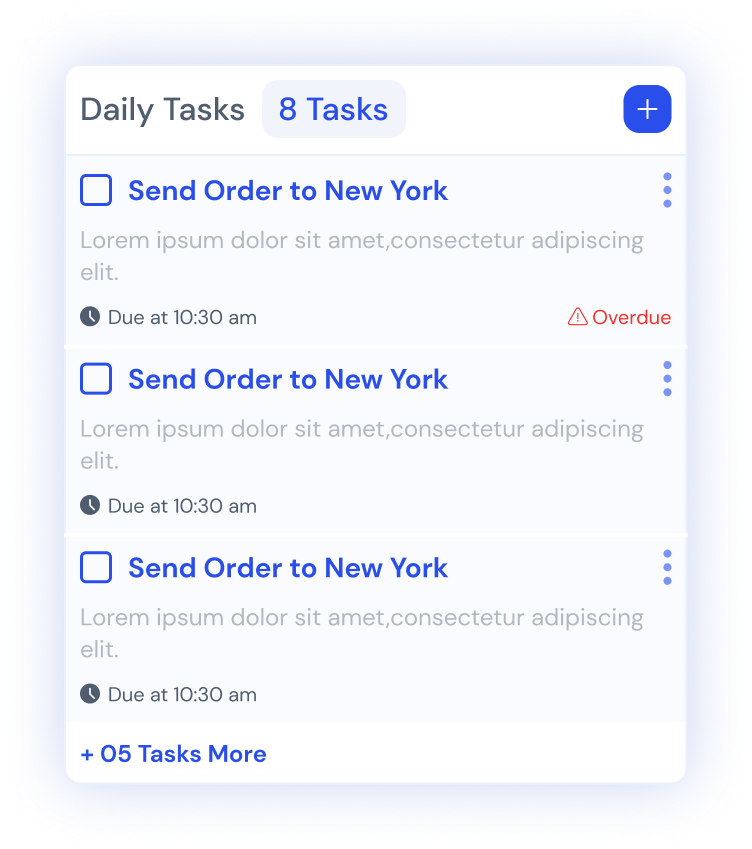
Customisable Task Management
- Actionable Task Management: The widget prioritizes upcoming tasks, visually identifies overdue tasks, and allows for easy one-click completion with automatic re-ordering for a streamlined workflow.
- Customizable for Store Needs: Users can configure the task list to reflect specific store priorities and roles, allowing for addition, removal, and prioritization of tasks.
Visual Design
- Clear and Concise Presentation: Each task should be displayed prominently with concise wording for effortless comprehension.
- Visually Differentiated Statuses: Consider using color-coding or icons to differentiate overdue and completed tasks within the list for quicker visual identification.
User Experience (UX) Considerations
- Effortless Task Management: The widget should be designed to encourage user engagement with daily tasks through a smooth and intuitive experience.
- Actionable Insights: The prioritized and customizable list, along with clear completion functionality, empowers users to manage their daily routines and maintain store operations efficiently.
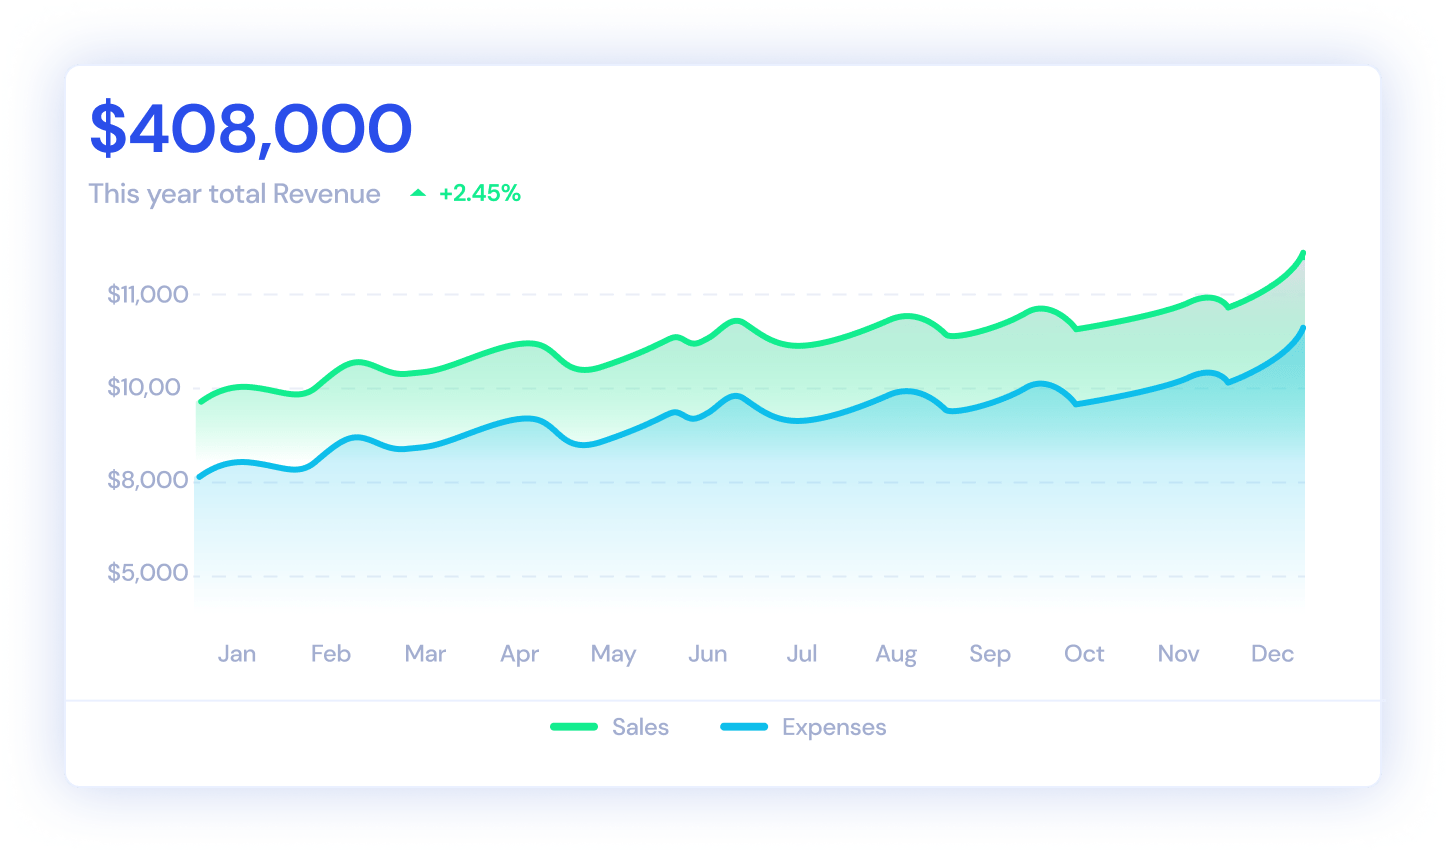
Year-Over-Year Revenue Trend Widget
This widget provides a high-level overview of annual revenue trends, allowing users to visualize sales and expense distribution across a 12-month period. Additionally, it facilitates year-over-year comparisons by highlighting percentage changes in performance.
Data Visualization
- Clear Timeframe Representation: Utilize a well-defined visual format to represent revenue and expense trends over a year effectively.
- Year-Over-Year Comparison: Integrate year-over-year percentage changes into the visualization, allowing users to identify performance fluctuations compared to the previous year quickly.
- Optional Interactive Features: Explore the possibility of allowing users to hover over specific data points to reveal detailed information (optional).
Overall Design
- Focus and Clarity: Prioritize a clear and concise layout, ensuring the key revenue trends and year-over-year comparisons are readily apparent.
- Data Accuracy: Ensure the accuracy of the displayed data and consider incorporating data source references (optional).
Other widgets
Low Stock Widget
- Purpose: This widget empowers users to proactively manage inventory levels by displaying items with low stock.
- Configurable Thresholds: Users with permissions can define low stock warning levels based on their specific needs, ensuring timely notifications.
- Seamless Reordering: The widget integrates with existing supplier details (configured upfront) to facilitate easy reordering of low-stock items directly from the dashboard.
Top Selling Widgets
- Customization Options: Users have the flexibility to configure and add various “Top Selling” widgets to their dashboard.
- Default Configuration: The initial dashboard will showcase widgets for “Top Selling Items” and “Top Selling Categories” to provide immediate insights.
- Advanced Customization: Users can further personalize their dashboards by configuring widgets to display custom data, such as “Top Selling Products by Category” or “Top Selling Brands.“
New Arrivals Widget
- Purpose: This widget helps store managers identify new or recently restocked items.
- Strategic Placement: Including this widget in the default configuration ensures store managers have immediate visibility of new products.
- Decision-Making Support: By highlighting new arrivals, users can make informed decisions about product display and promotion strategies within the store.
Outcome / Results
Despite extensive research and a well-defined design focused on user control and actionable insights, the customizable dashboard project ultimately couldn’t be implemented due to funding limitations.