Sysdig Monitor Gets a Cutting-Edge Alert and Notification modules Makeover
Overview
Sysdig uses alerts to notify users about potential infrastructure issues based on changes in collected metrics. These metrics act as dials, and when a reading goes beyond a set threshold, an alert triggers to grab your attention.
Our goal was to make this process smoother and more user-friendly.
Timeline
February 2022 – Jan 2024
Contribution
User Research / Snap Testing / Quick Prototype / Data Analysis
Tools
Figma / Periscope / Pendo
User Research & Pain Points Identification
To understand user needs, we employed a multi-pronged approach:
Data Analysis
Tools like Periscope and Pendo helped us analyze user behavior patterns. We looked at:
Frequently created (and discarded) alert types (indicating potential confusion)
Heavily modified types (suggesting usability issues)
Customer Workshops
We validated quantitative data through workshops, where users mapped their existing goals to proposed new user journeys.
Competitive Analysis
We analyzed competitor tools and market trends to identify gaps in our offerings.
Based on these insights, we identified key areas for improvement:
Limited Alert Types
We needed to expand functionality to address diverse monitoring needs.
Alert Configuration Challenges
Users struggled to configure thresholds accurately, often needing multiple edits.
Inefficient Investigation
Alert investigation lacked clear workflows for troubleshooting.
Designing for a Smoother User Experience
We addressed these pain points through several design interventions:
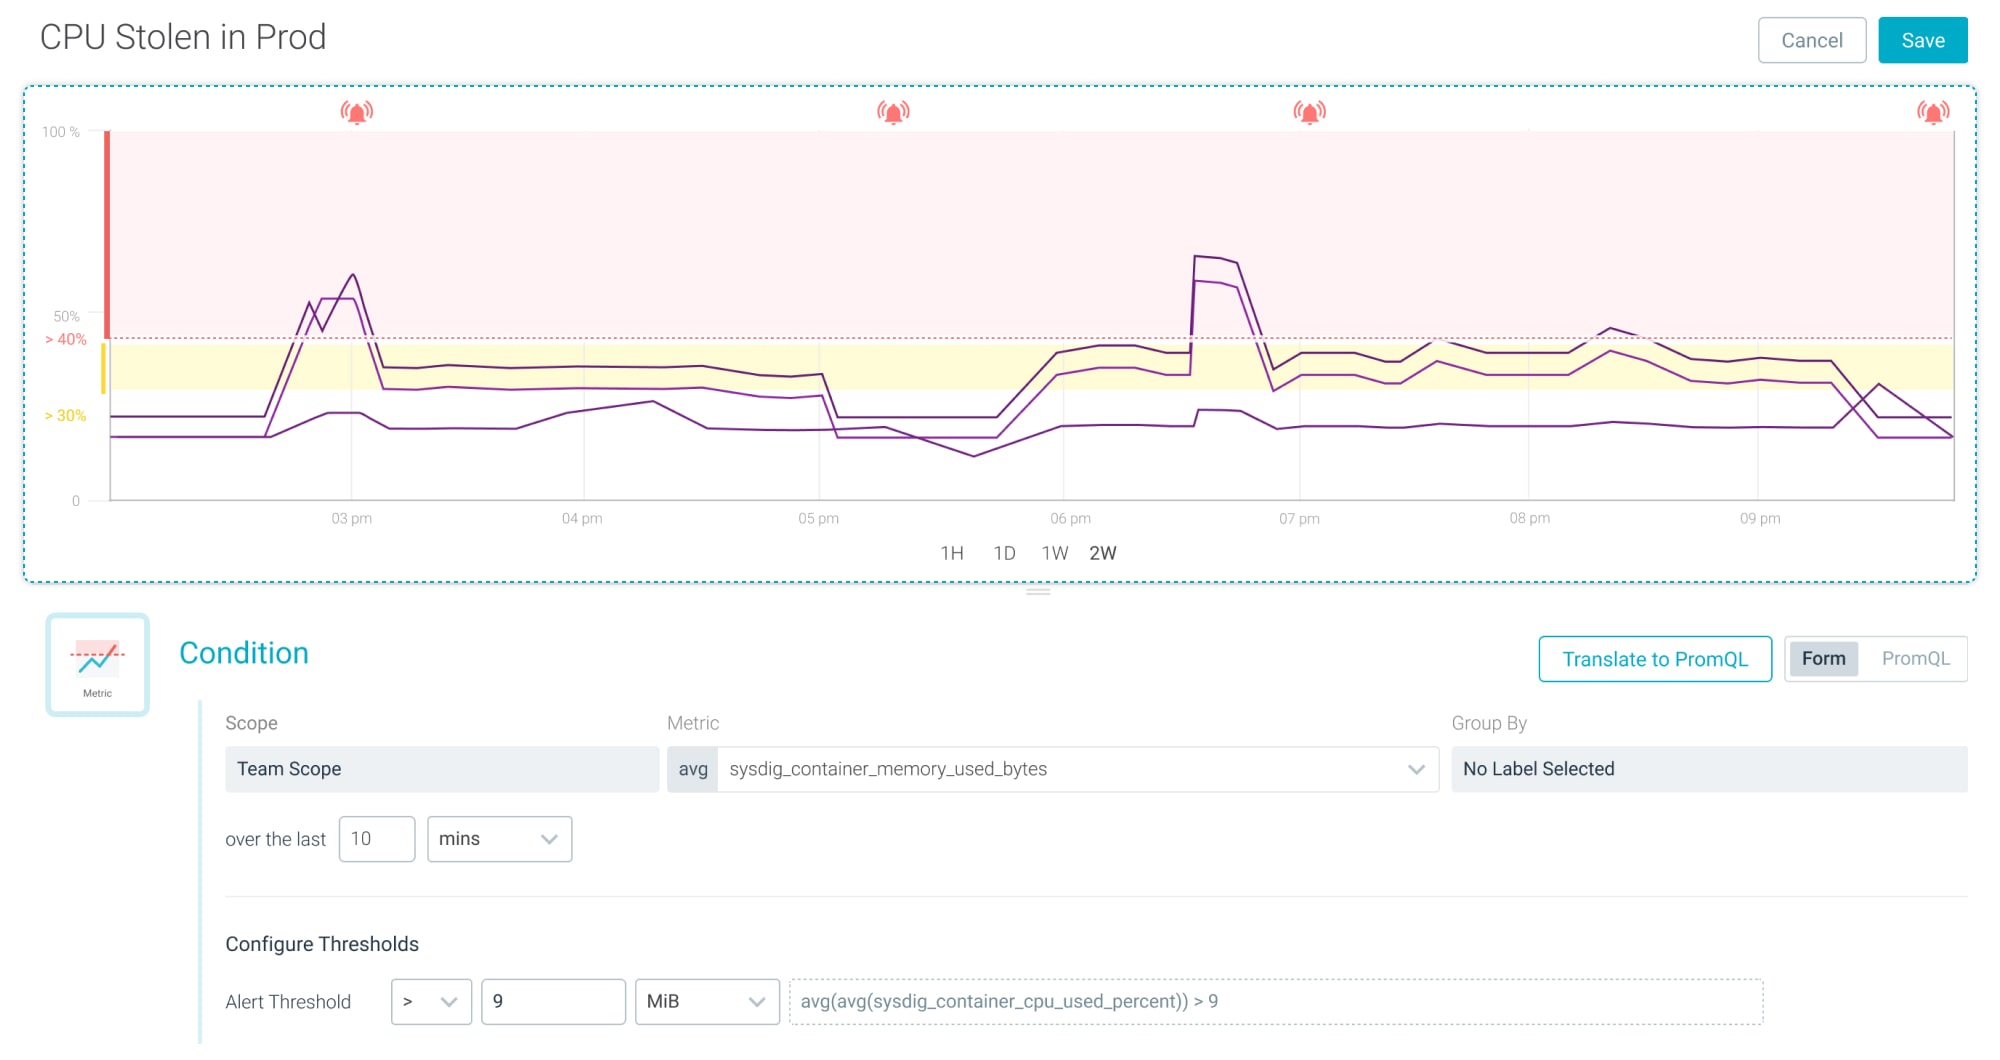
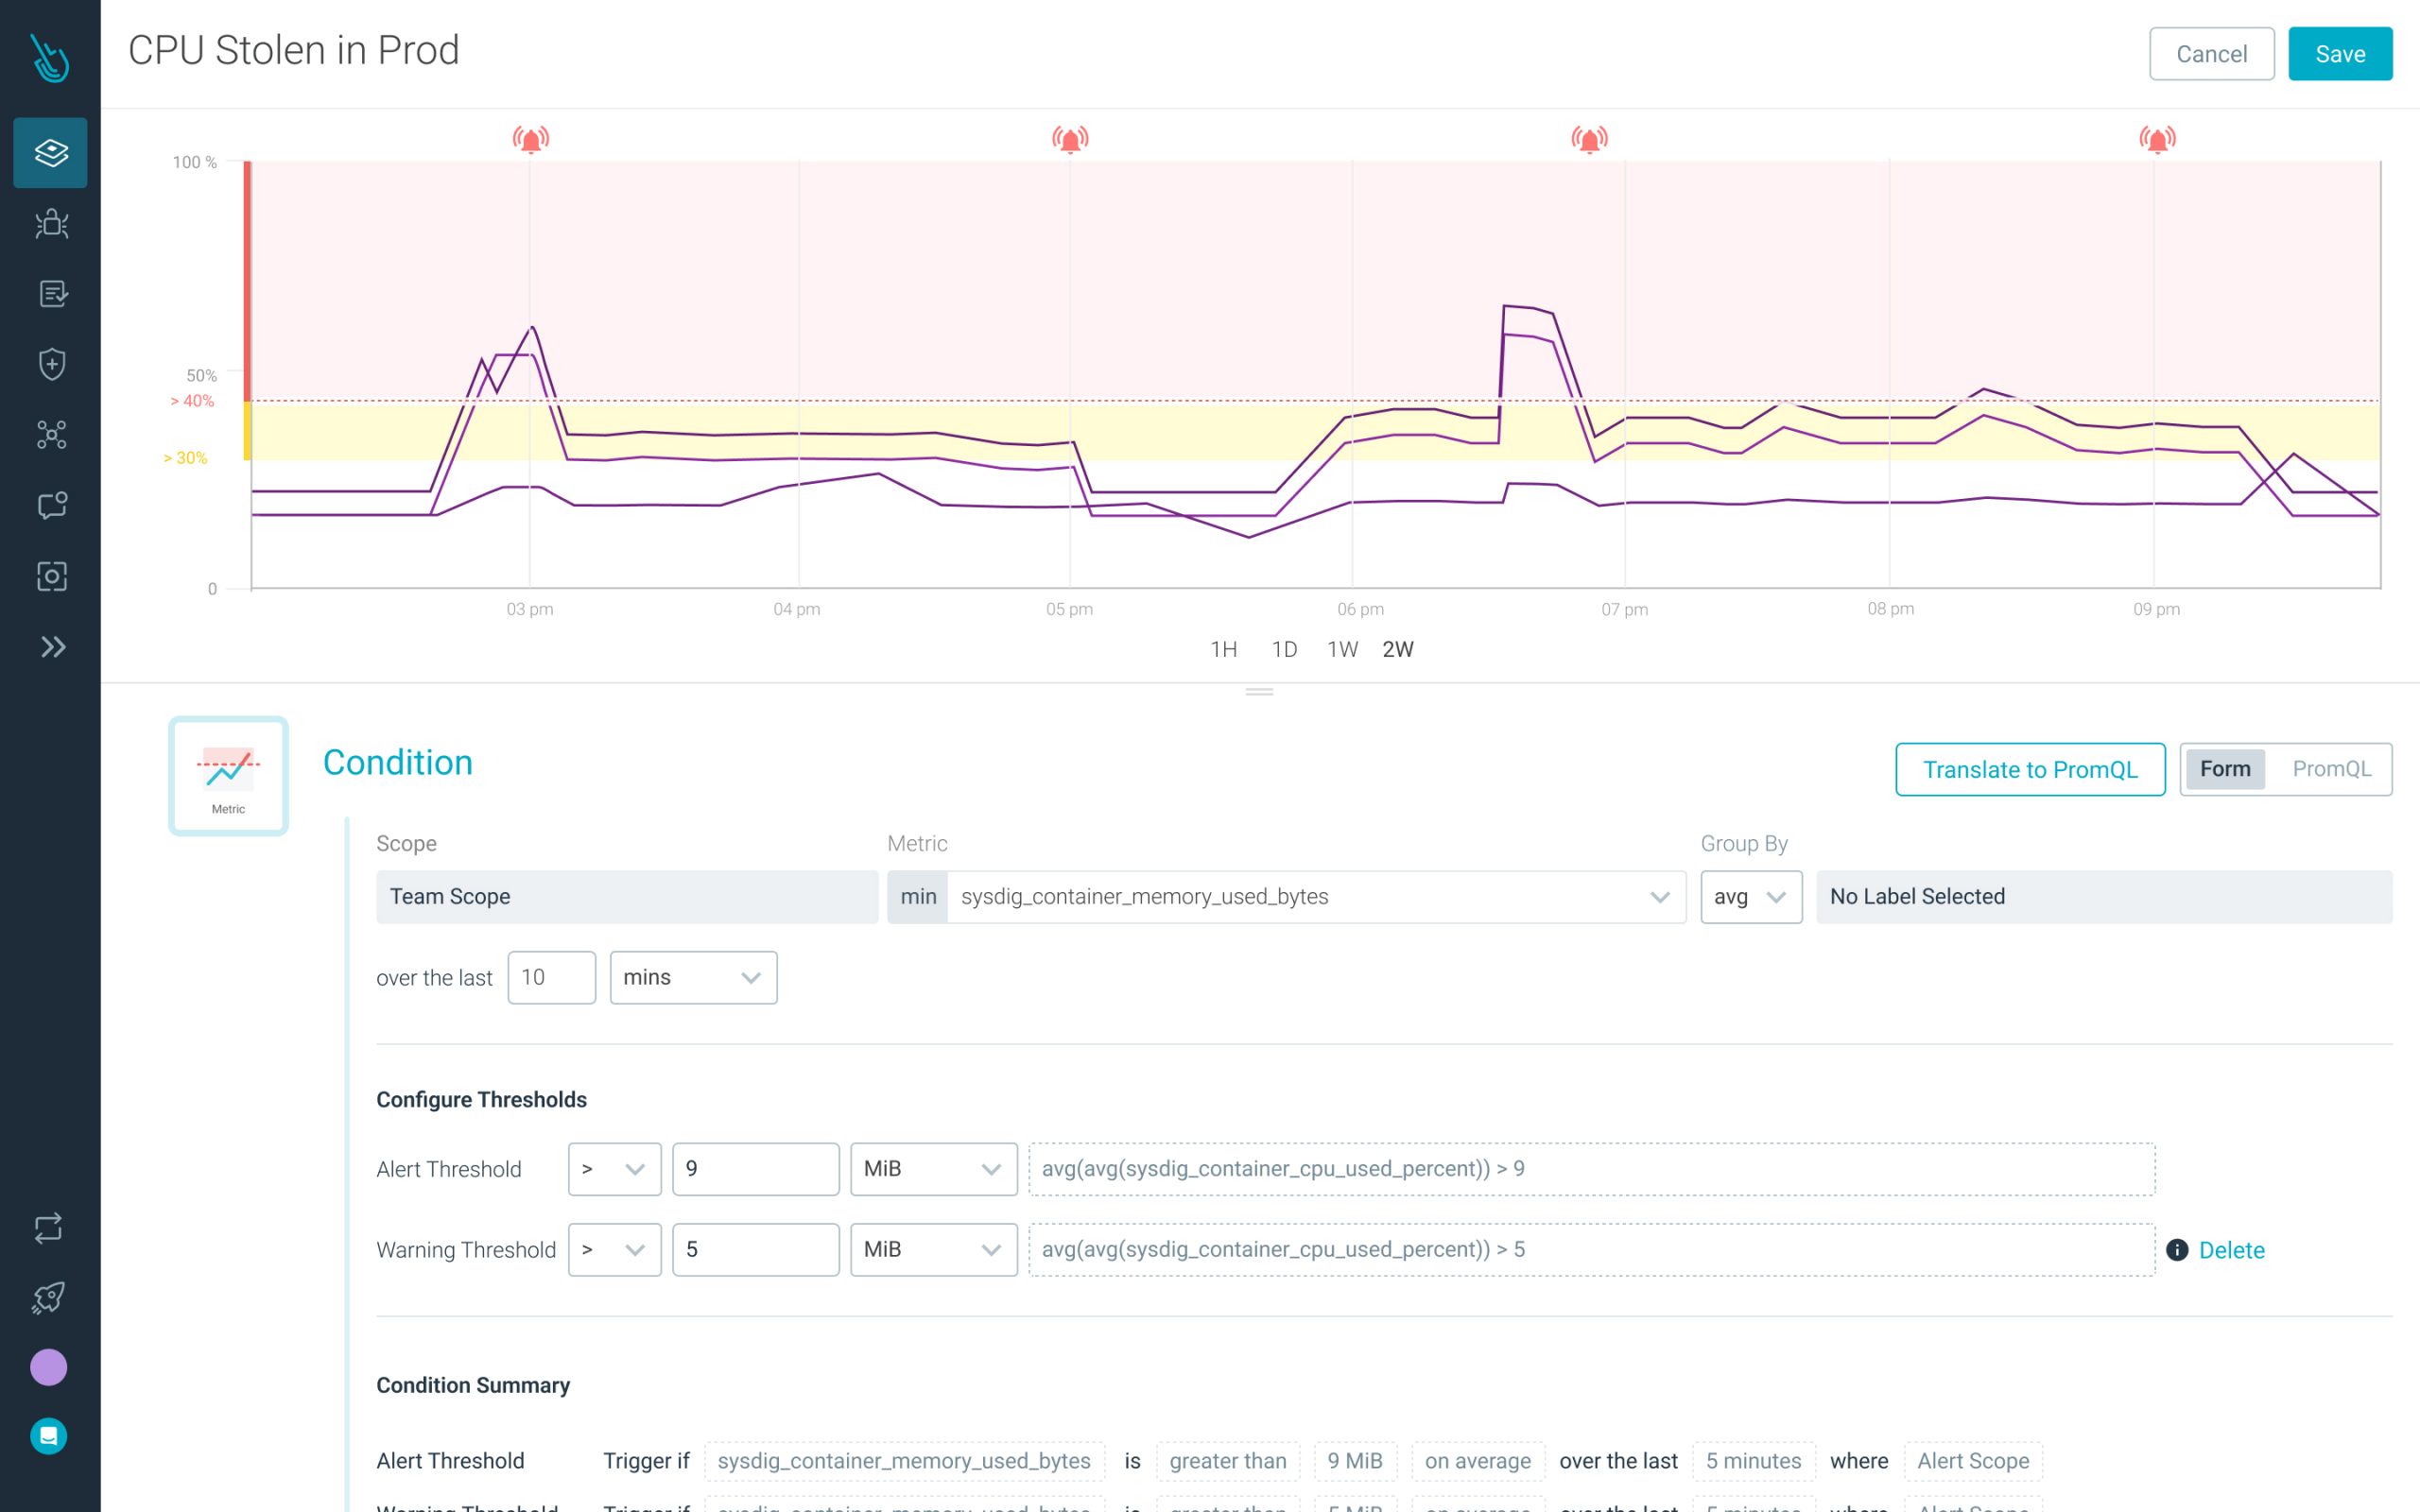
Real-time Alert Previews
Users can now see how historical data impacts metric behavior, helping them set accurate thresholds on the first try.
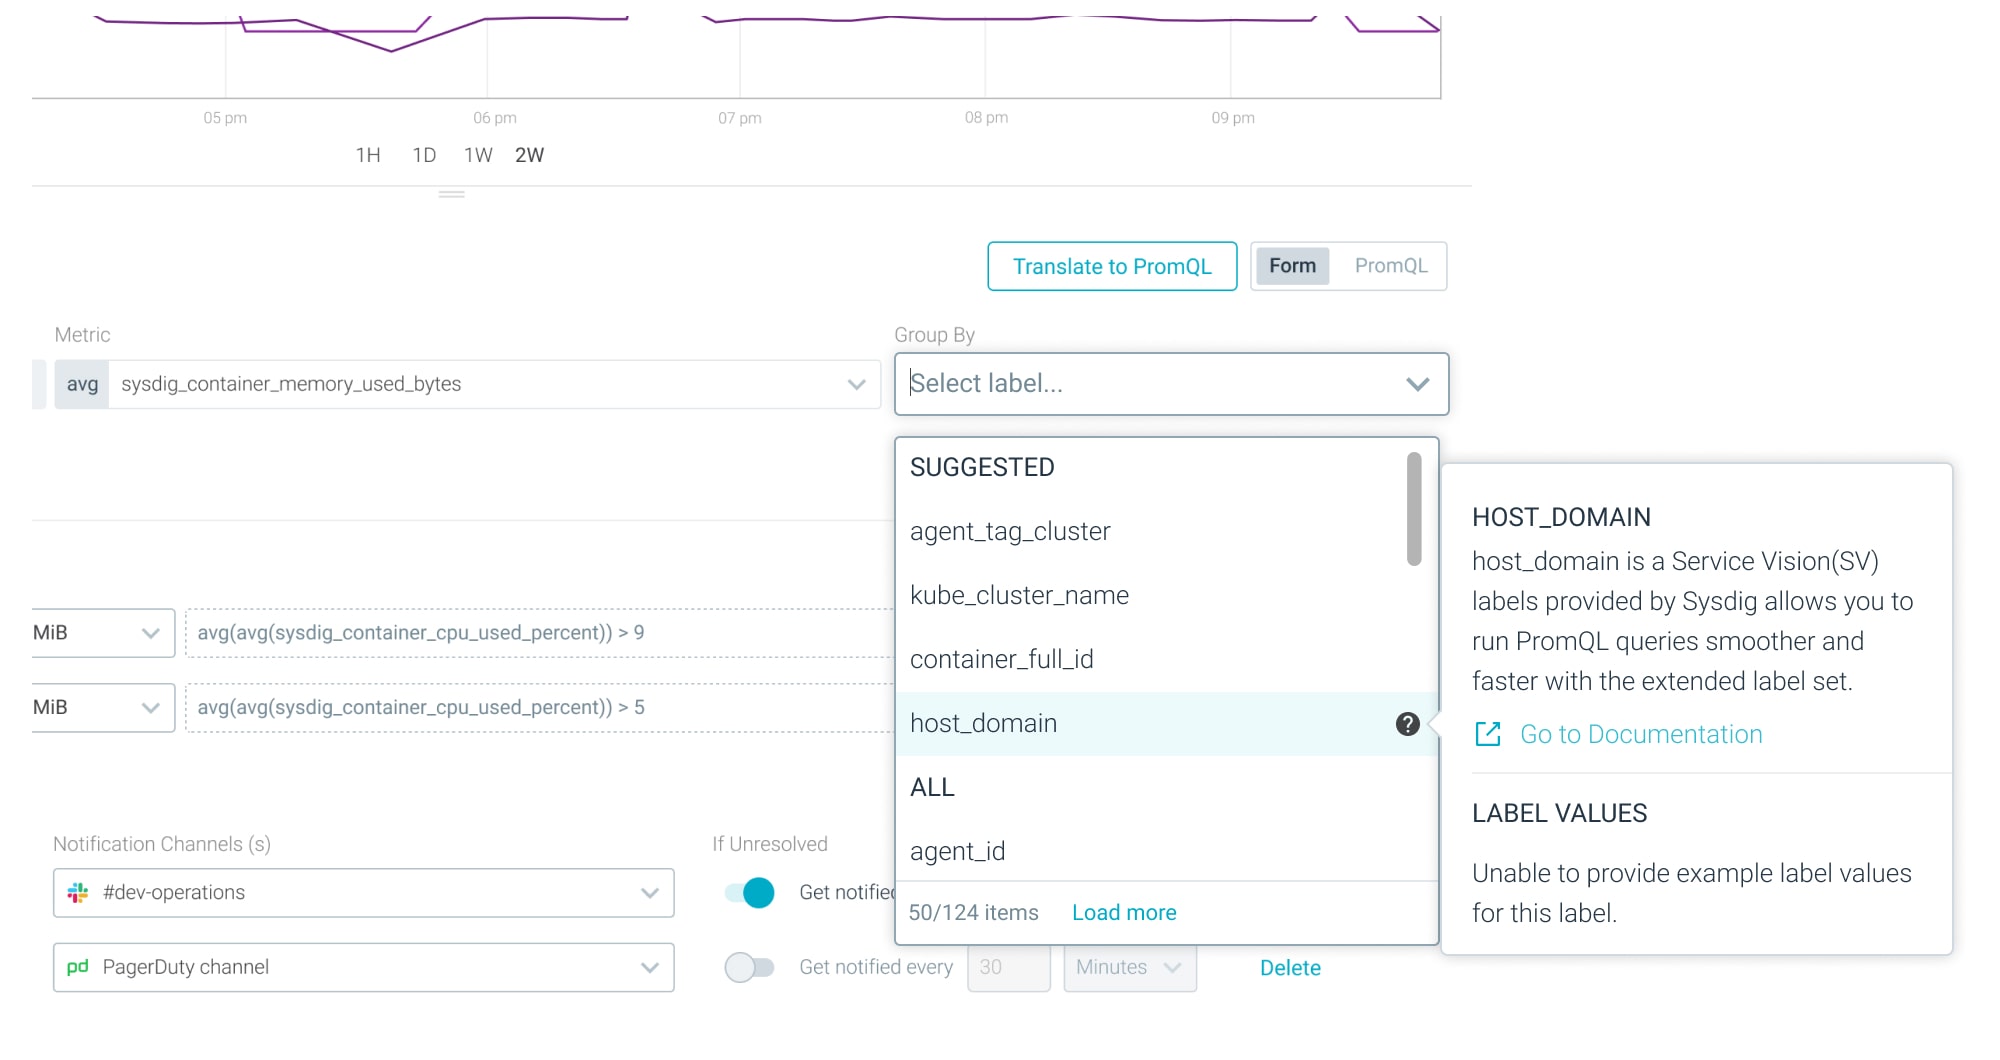
Metric Label Selector
This feature provides documentation and suggestions for labels, ensuring users choose the right metric for their alert.
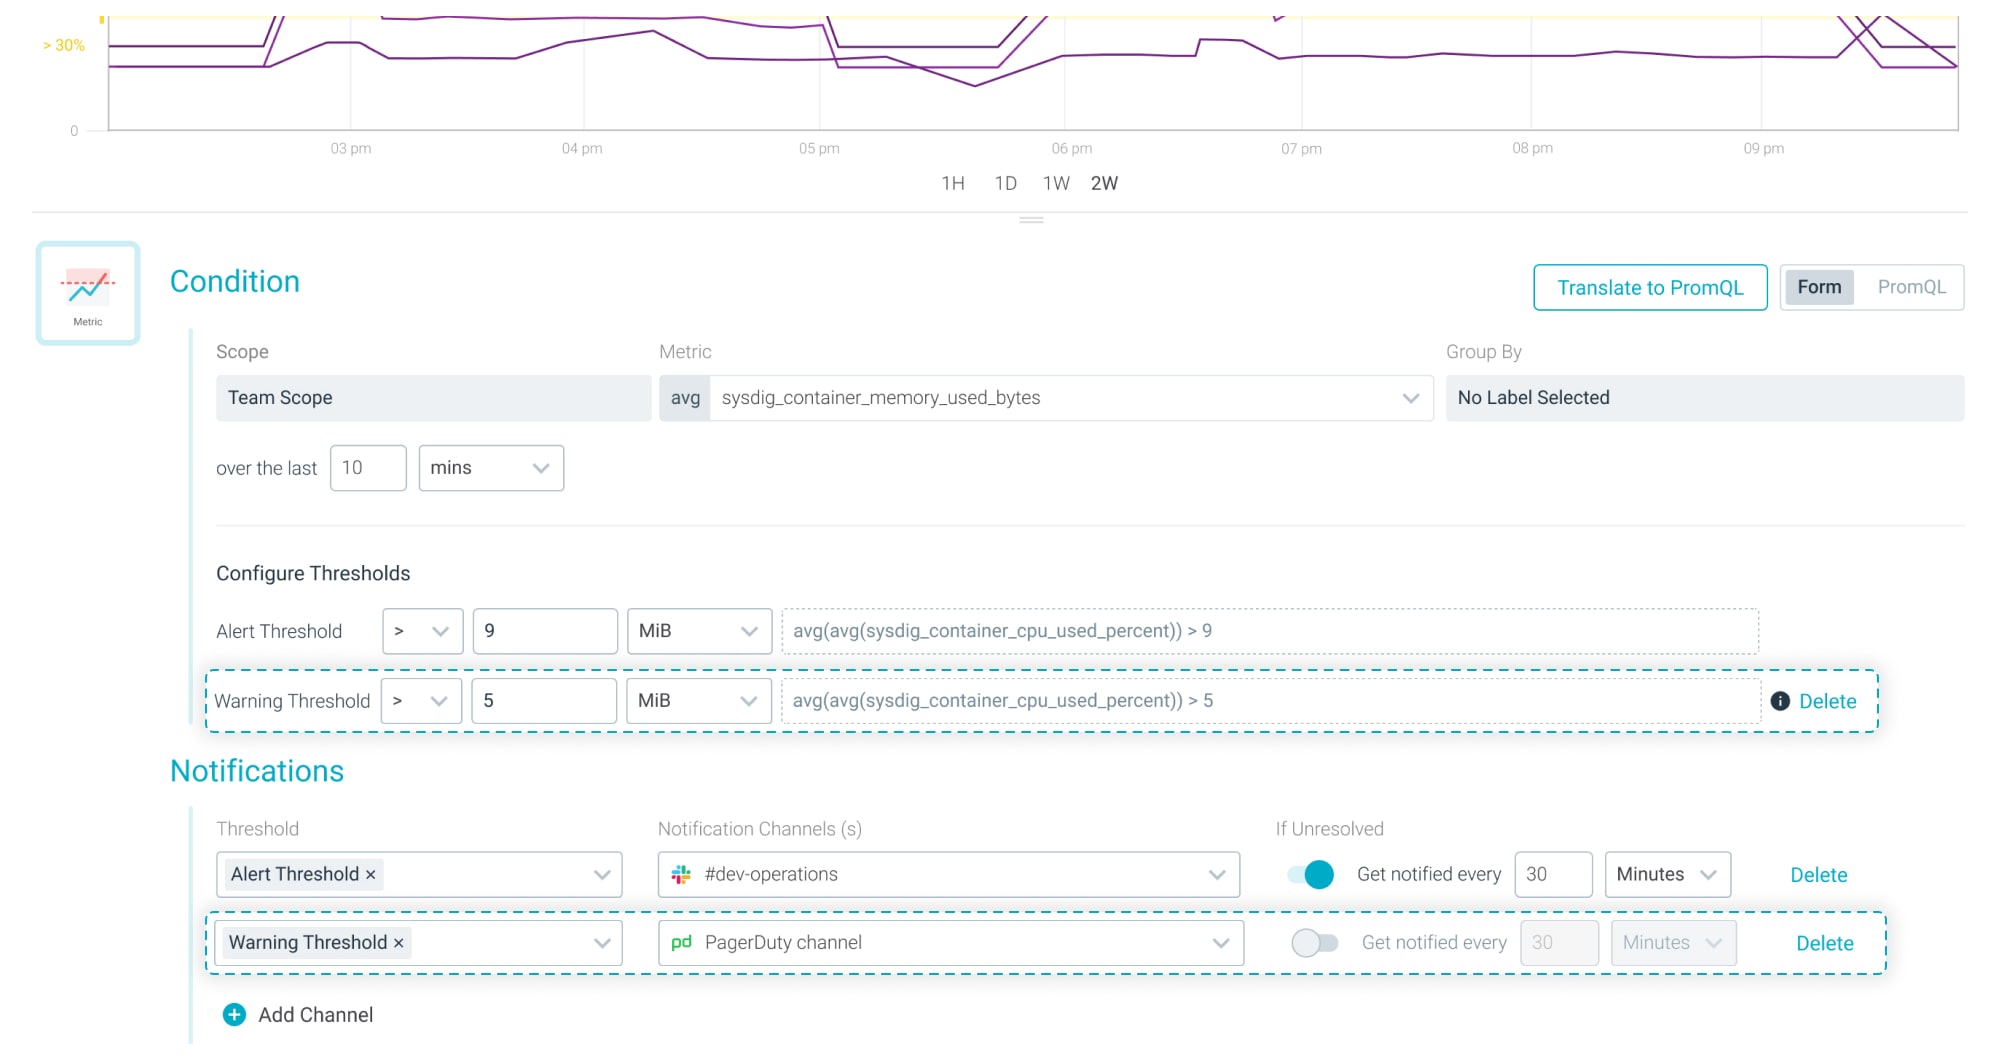
Warning Thresholds
Users can define separate notification channels for warning thresholds, eliminating the need for duplicate alerts.
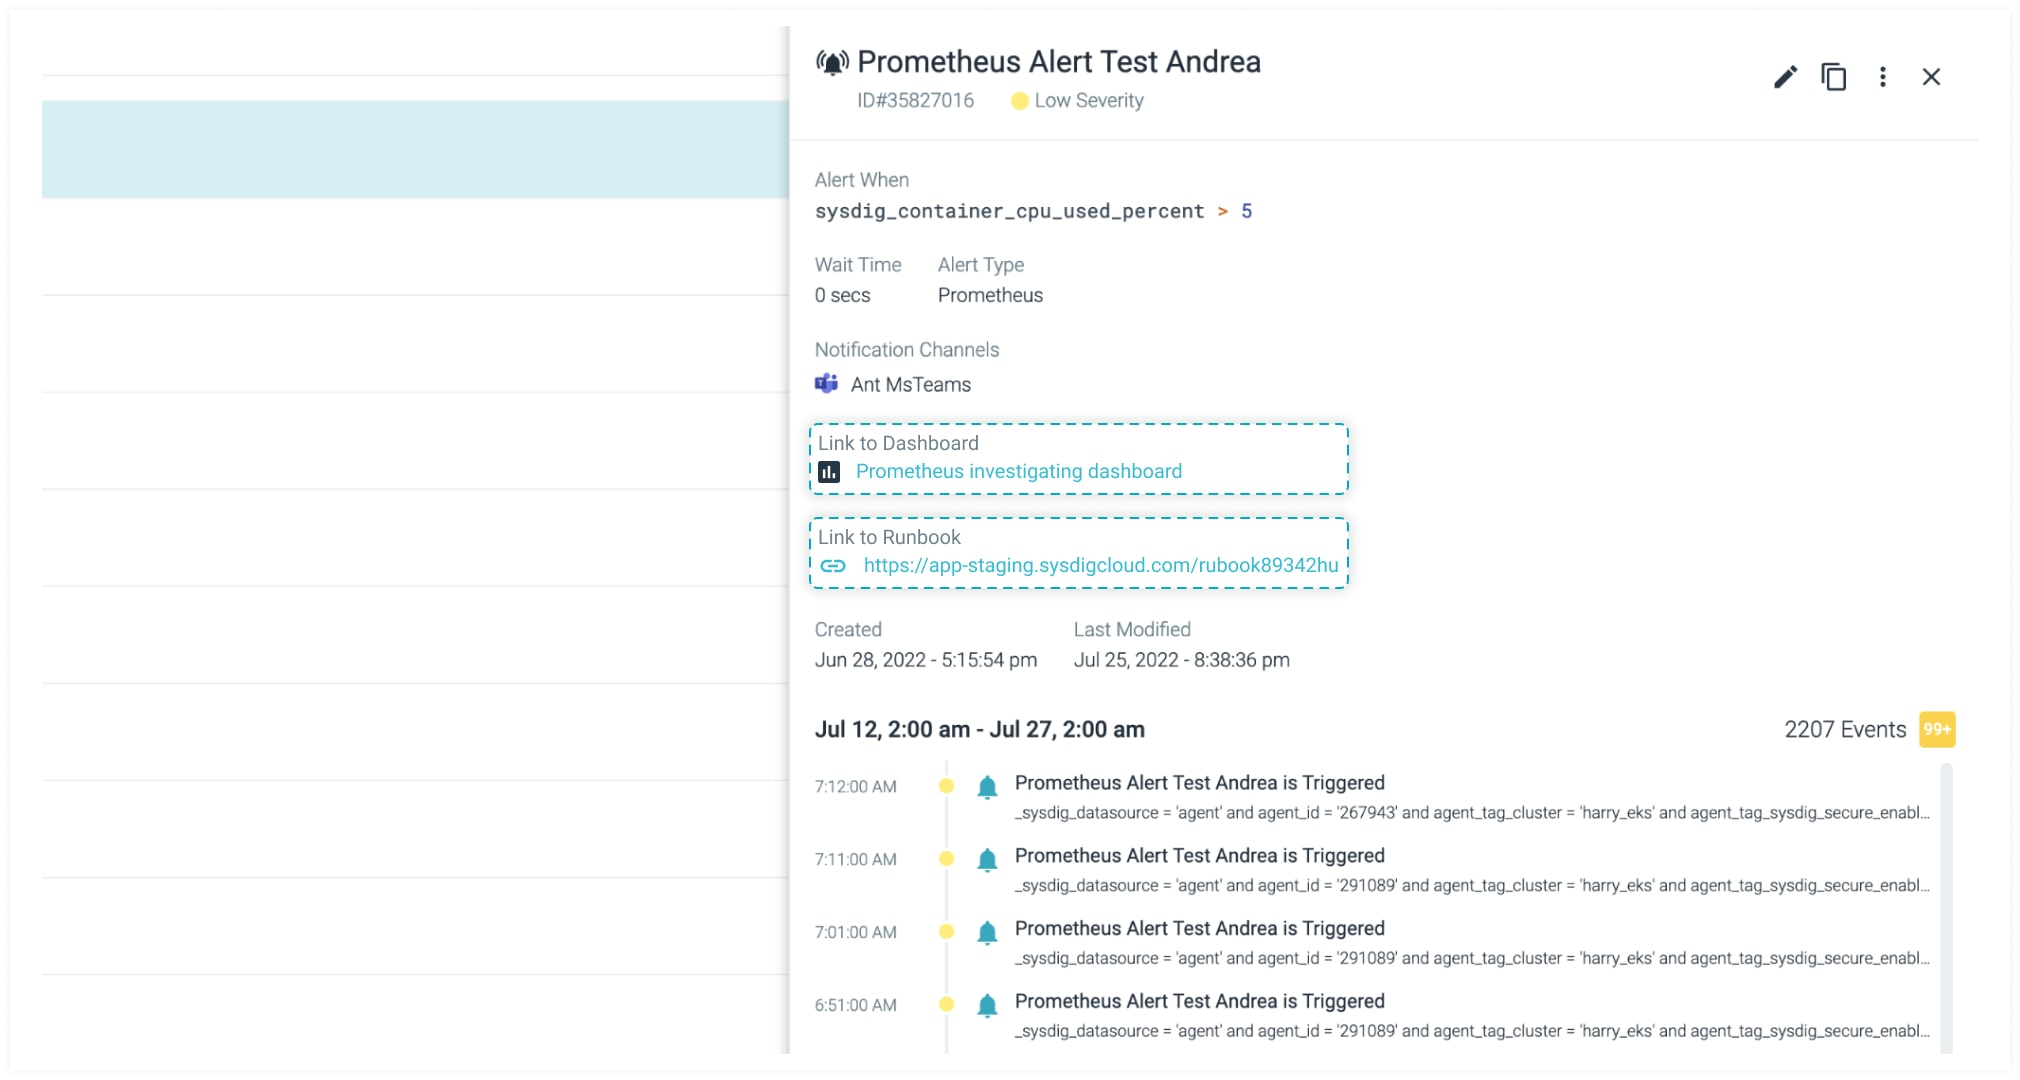
Enhanced Investigation
Alerts can now link to relevant dashboards and runbooks, streamlining troubleshooting workflows. These links are also embedded in notification channels for easy access.
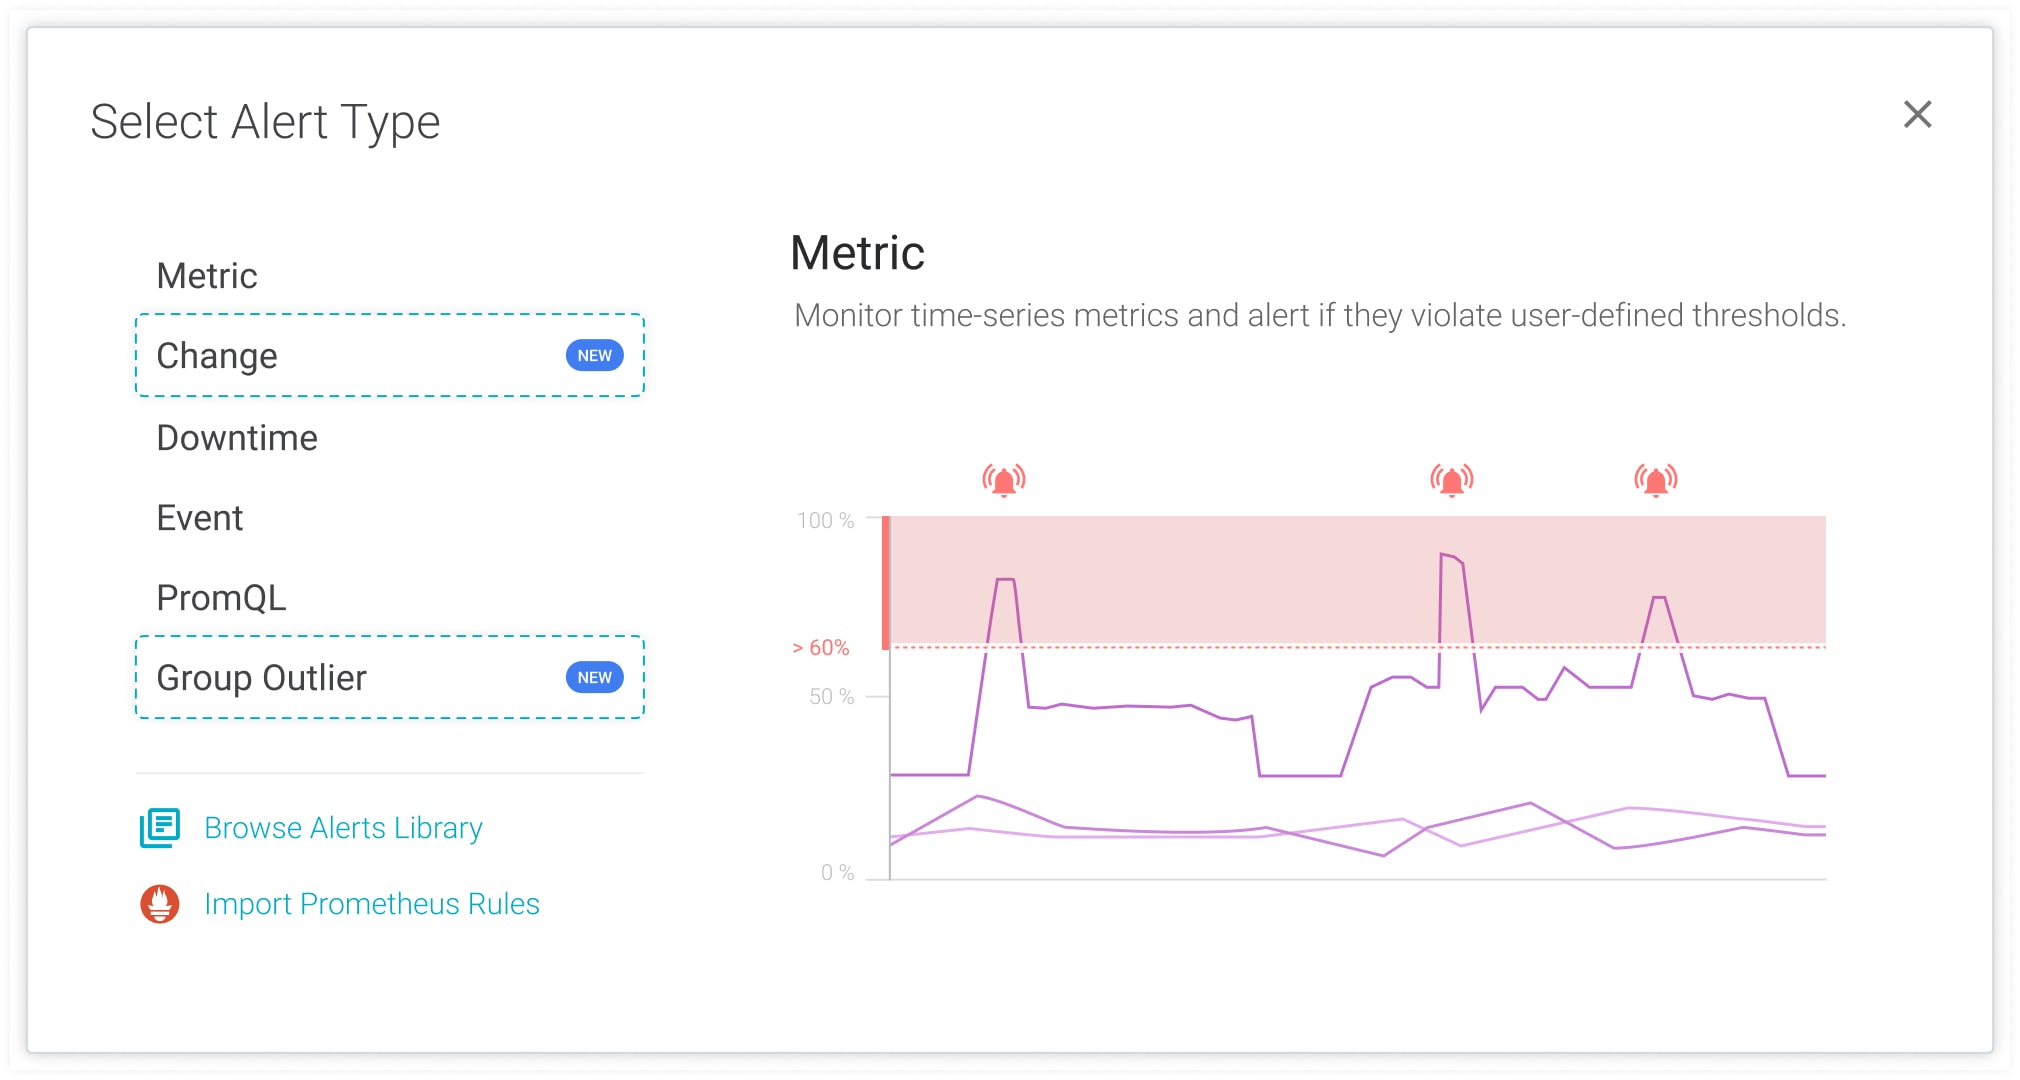
Expanded Alert Types
New alert types like “Change Alert” and “Group Outlier Alert” provide users with more granular monitoring capabilities.
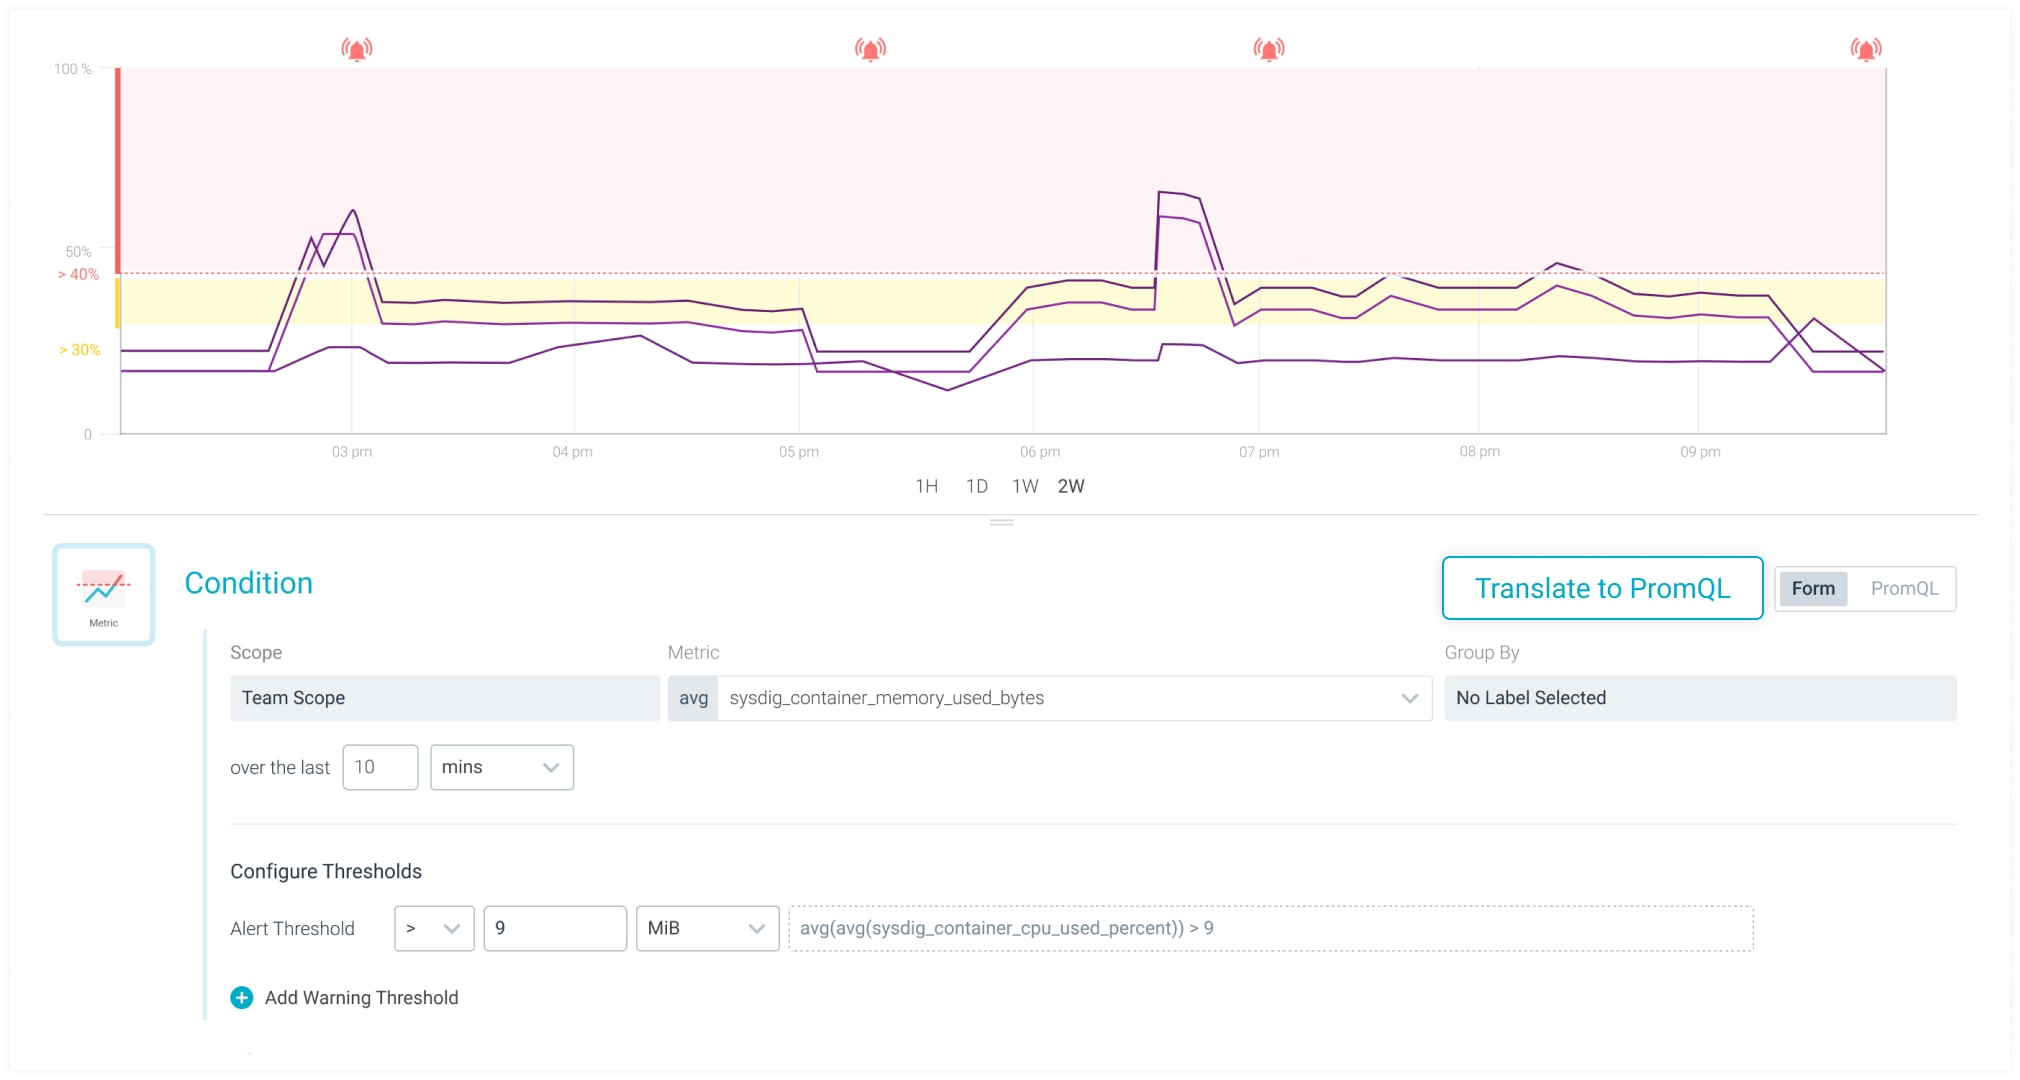
Prometheus Query (PromQL) Integration
Users can translate metric alerts into PromQL alerts, leveraging PromQL’s power even without advanced knowledge (through form-based assistance).
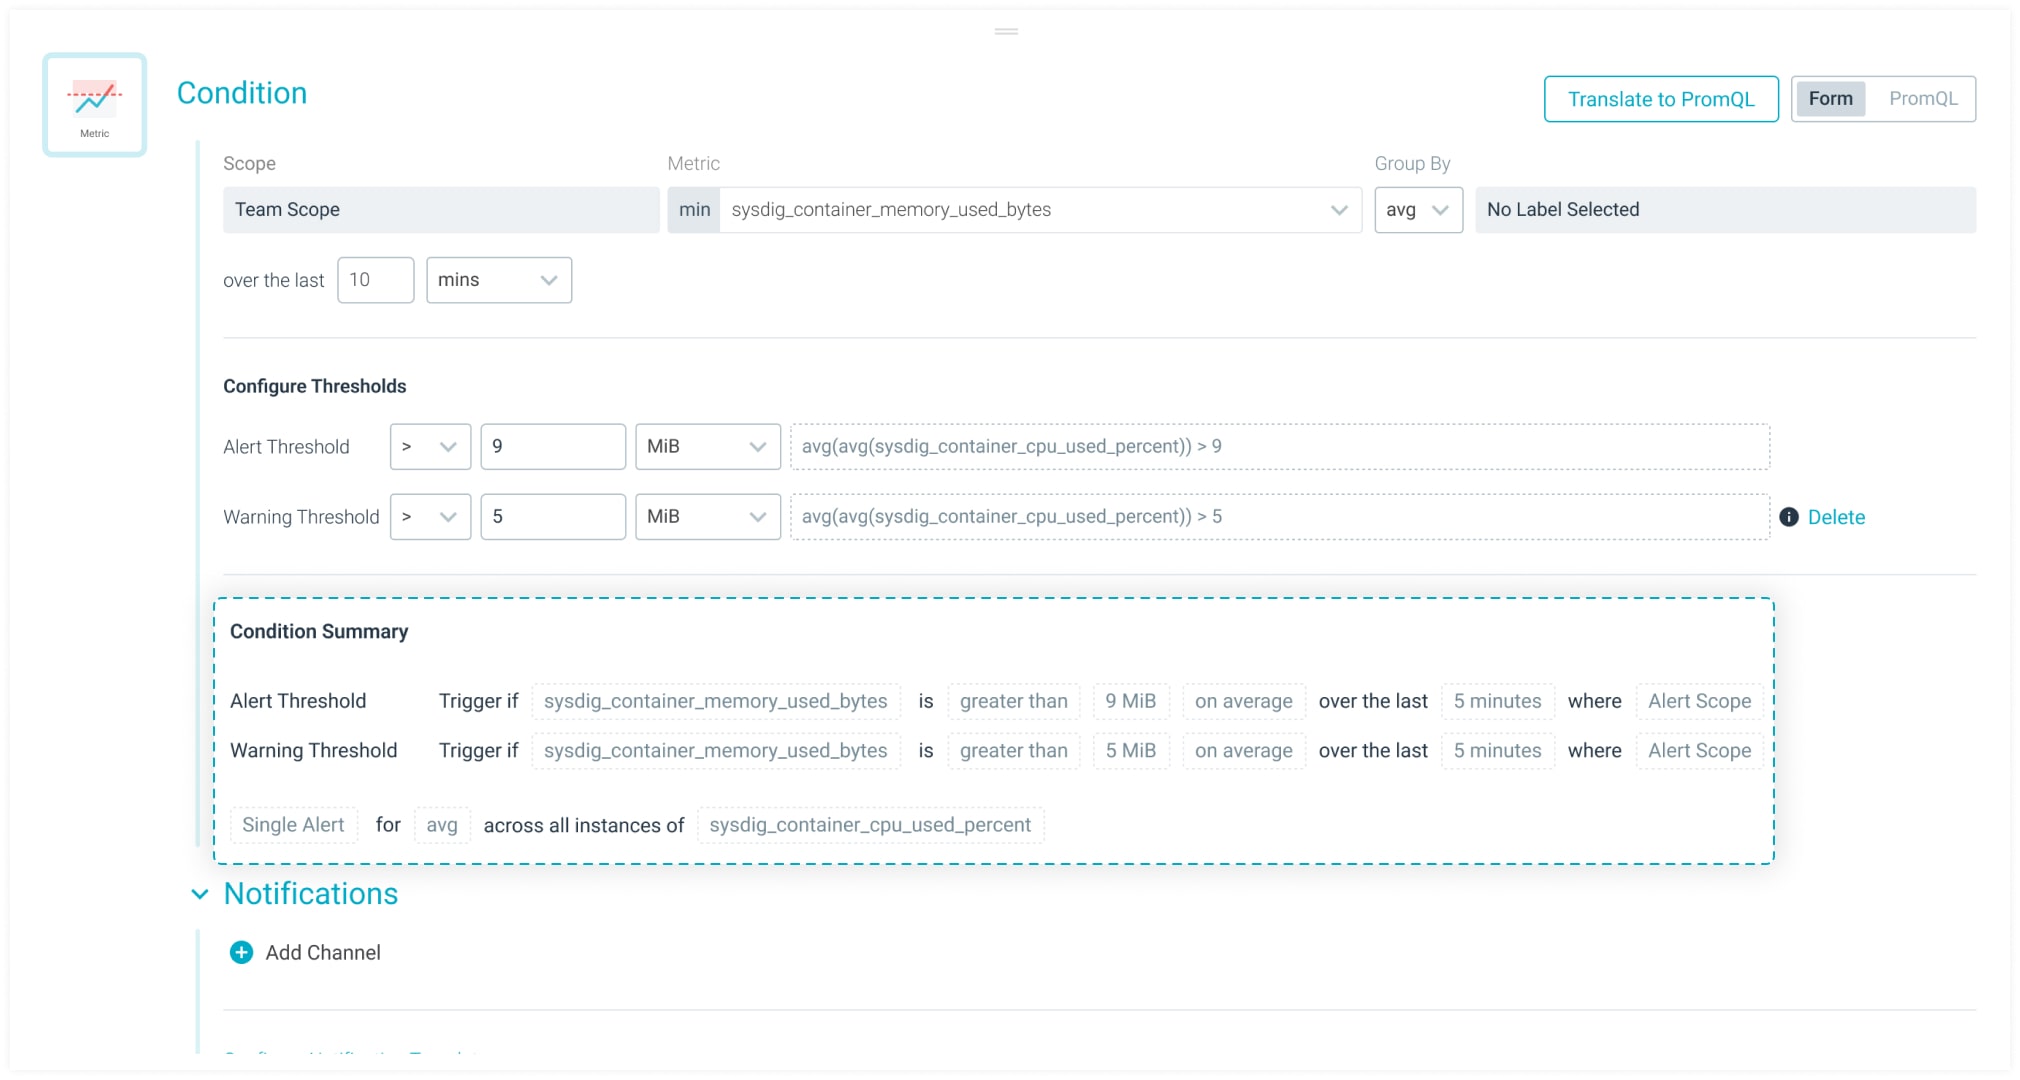
Clear Alert Summaries
Alerts are presented in plain English, making technical details easier to understand.
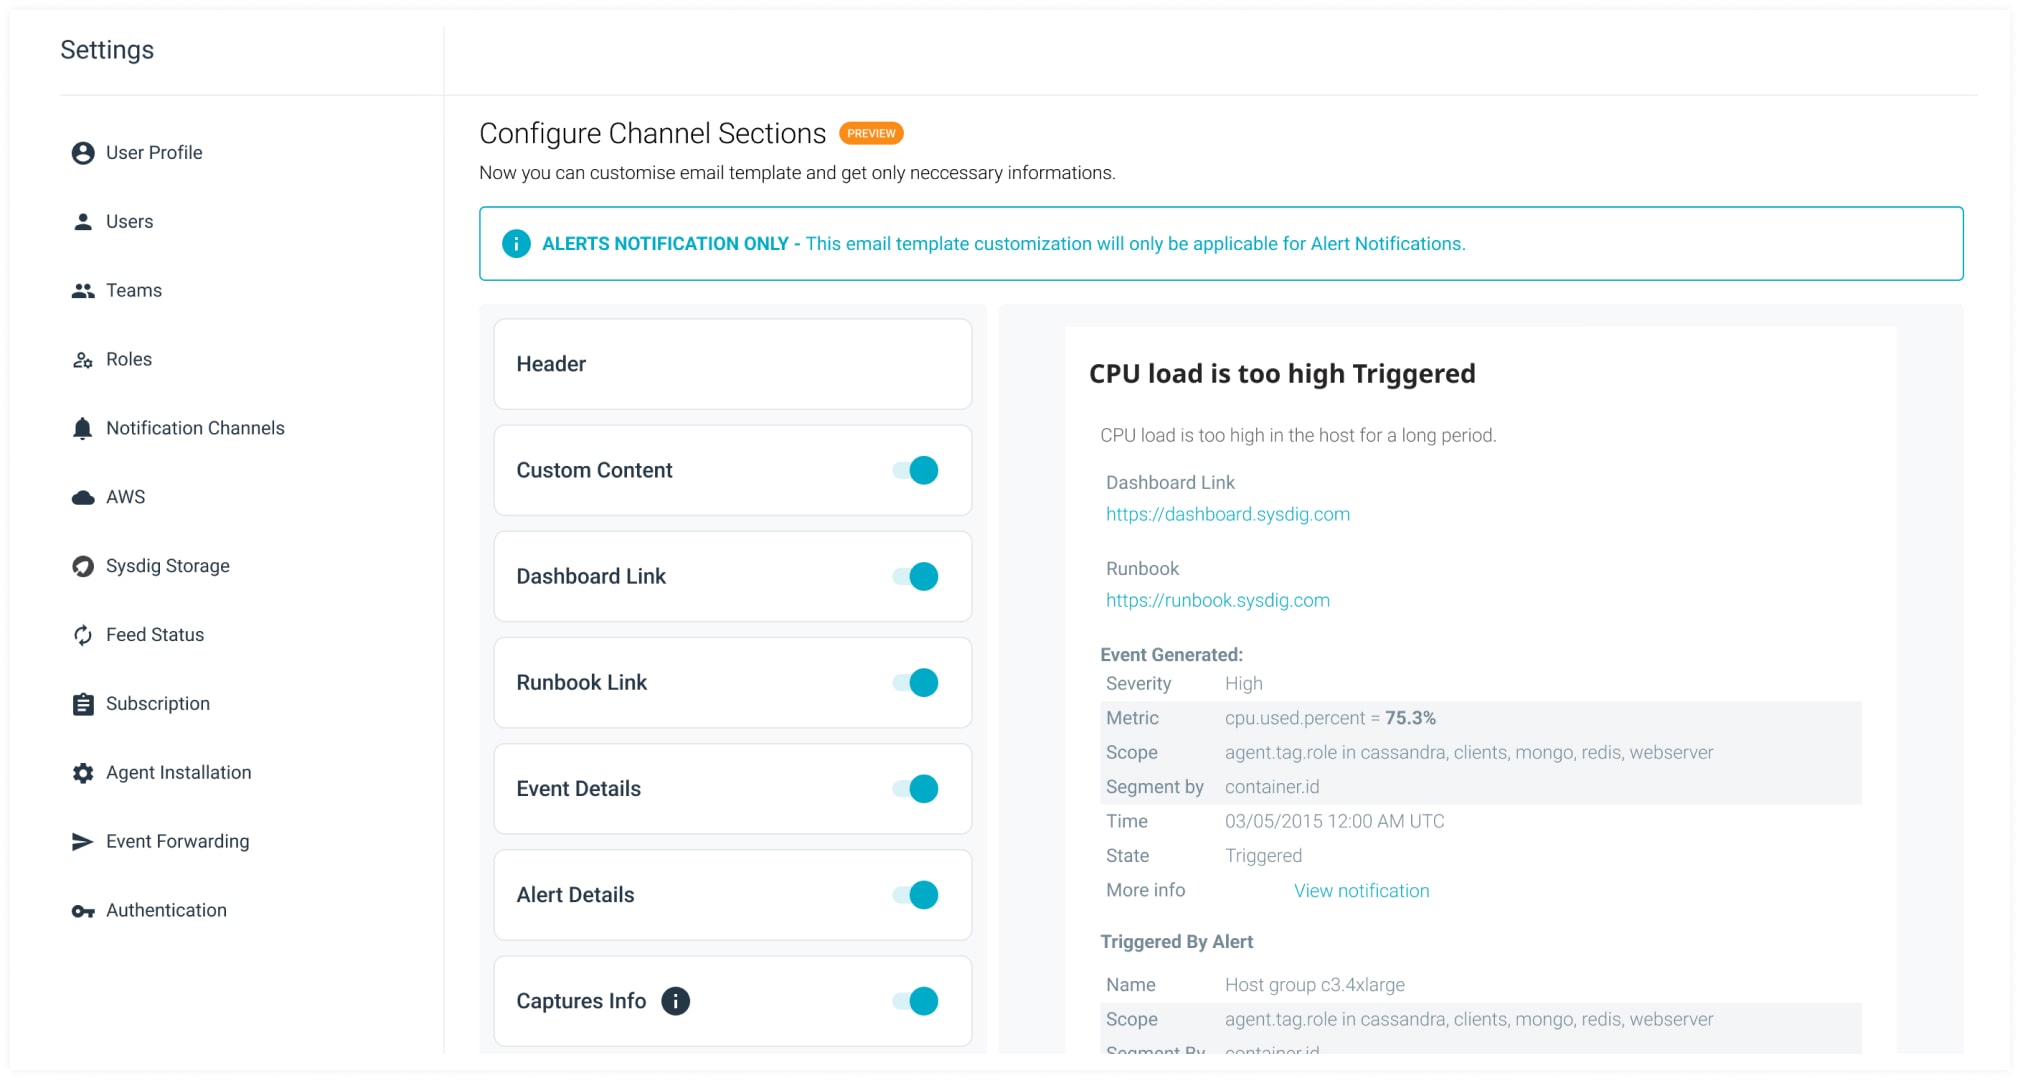
Highly Customizable Notification Channels
Users can tailor notification content to their needs. We also introduced metric behavior snapshots for quick visual analysis (initially available on Slack and email).
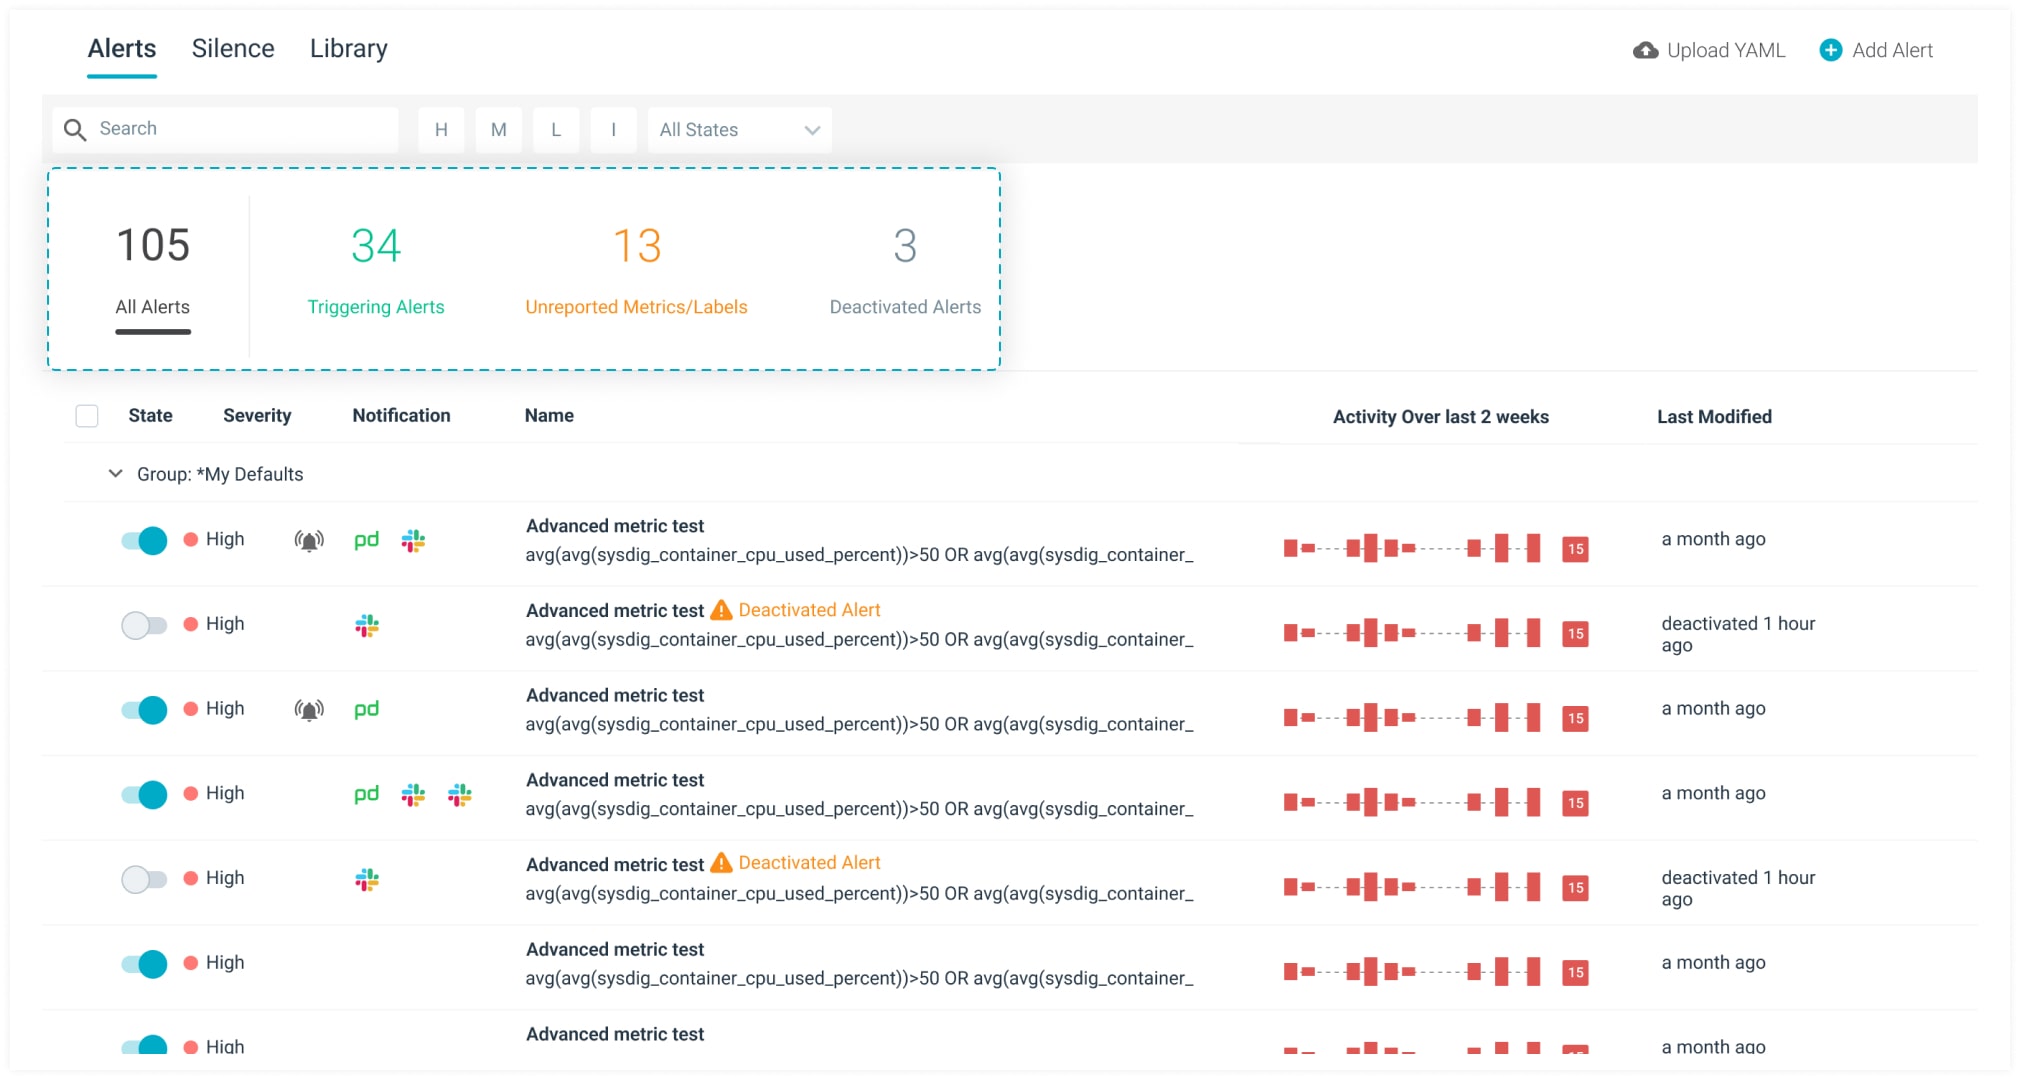
Improved Alerts List Page Filtering
Improved alert discoverability by providing filtering options for currently triggering alerts, alerts with unreporting metrics, and deactivated alerts.
Measuring Success: User Behavior & Feedback
Our data showed positive user behavior changes:
Users started creating a wider variety of alert types, indicating a better understanding of their monitoring options.
Warning thresholds were underutilized initially, likely due to the lack of a single-alert merge option. We're exploring solutions to address this.
Label editing after alert creation significantly decreased, suggesting users were making informed label choices with the new selector.
Notification channel customization was highly appreciated, prompting a second project phase to extend it to more channels and introduce a powerful webhook editor.
Conclusion
The revamped user experience demonstrates how design thinking can empower users with the information they need, presented in a clear and actionable way. We’re committed to continuously iterating and improving based on user feedback, ensuring Sysdig remains a user-centric platform for infrastructure monitoring and security.
